A prominent recent example was Ryan O'Hare, in the Daily Mail, headline:
"2015 may NOT have been the hottest year on record after all: Satellite data shows temperatures were lower than first thought"
Totally inaccurate, of course. Satellite temperatures do not contradict the surface record. They say (less reliably) something about the temperature in a different place. But this seems to be being worked up as the standard distraction from the 2015 record temperature. For last year's record, they tried Oh, but we can't be sure. This time the margin will be too great for that, so satellites will have to do.
There is a WUWT post here which tries by comparison to suggest that surface temperatures are trending differently to troposphere, and are therefore wrong. It's one of many, and graphs like this crop up:
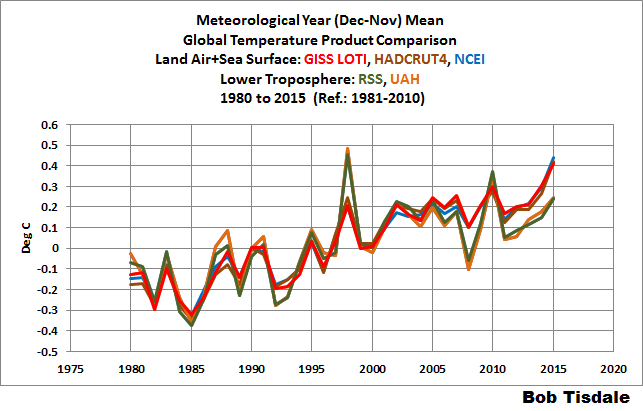
I drew attention here to the huge adjustment that was made to UAH this year, in going from V5.6 to V6. In fact, the V6 plotted above is still in beta, and V5.6 is still maintained. So recently I restored it to the datasets that I collect and plot, and you can see it in the active plot. So I thought I would add V5.6 to this comparison. And sure enough, V5.6 is far closer to the surface measures than it is to V6 (or RSS). Below the fold is a snapshot, where the anomaly base is 1981-2010 for all:

This is monthly data smoothed with a running 12-month mean. The land/ocean indices GISSlo and NOAAlo are very close. RSS and UAHv6 less so, but yes, clearly diverge from surface. But again, UAHV5.6 is much closer to the surface measure. Now it may be that there are good reasons why UAH made such a big change only a few months ago. But it's a very weak basis for saying that the surface measures are wrong. Of course, the greater weakness is that they are measuring different places. But if UAH sometimes agrees, sometimes not, it could hardly ever be a convincing counter.
I find the "trendback" mode of that plot also revealing. This shows trends from a varying start, shown on the x-axis, to present.

Now you can see that UAH V5.6 behaves very like the surface indices. V6 and RSS are different.
There is an interesting aspect of that graph. At WUWT, Lord Monckton posts a monthly series on the Pause, allegedly of 18 years duration. At least, the series was monthly, but missed this month. It may expire. The "Pause" is measured where the green RSS trend plot first crosses the very faint zero trend line. You'll see that the crossing is now very brief, and with a couple more warm months, will go away. There is a second crossing near 2001, but that won't last long. So even by cherry-picking the least of the troposphere readings (and ignoring the actual surface), the "pause" will shrink, on that measure, to about seven years. That is, from an interval tilted by the 1998 El Nino, to one tilted by the 2010 version.
Update. UAH V5.6 still shows 2015 as the third hottest year. The first of my plots shows why. The troposphere really is a different place. Temperatures respond very strongly to an El Nino event, but late, in the year following. That is when records are set. So 1998 and 2010 were hotter than 2015. They won't be hotter than 2016.
Update See also Kevin's SKS article and comment


Mears et al. in JGR (2010) is highly relevant here:
ReplyDeletehttp://onlinelibrary.wiley.com/doi/10.1029/2010JD014954/full
The uncertainties in temperature trend are in excess of 0.1 K per decade. UAH (both vs5.4 and vs6) and RSS are consistent within these very large uncertainties.
Christy knows 2016 will be very warm and tries desperately to dismiss by advance global warming claims. UAH and RSS showed december 2015 were warmest on record and seems to panic while 2016 could beat his overestimated 1998 record year. If UAH keeps overstimating El Niño like it did before.
ReplyDeleteI also find the "trendback" plot revealing. What happens with the trends after ~1992? Why should they decrease if aCO2 is the knob?
ReplyDelete@edimbukvarevic I don't think anything happened in 1992. It seems to me it just got to close to the temperature bump in 1998.
DeleteThe graph shows the trend since the date on the X-axis. So when you get to looking at the trend from 1992 to 2015, there's not enough on the early (left) portion of the temperature graph to counter the 1998 rise.
David - eastern boundary upwelling was active in the Pacific, and a vast are of the surface of the Pacific cooled. Same thing happened 2005 to 2013. Making it possible when upwelling along the eastern boundary of the Pacific extends from the southern tip of South America to the Aleutians, there is going to be a slowdown of the trend... a completely temporary one.
DeleteBecause it's nonlinear, and CO2 is the knob.
ReplyDeletehttp://data.giss.nasa.gov/cgi-bin/gistemp/nmaps.cgi?sat=-1&sst=6&type=trends&mean_gen=1212&year1=1992&year2=1996&base1=1951&base2=1980&radius=1200&pol=reg
It is not necessarily true that 2015 wasn't the warmest year in the free troposphere.
ReplyDelete2015 is the warmest year in Ratpac A, globaly weighted 850-300 hPa layer, with 2010 second and 1998 third. The margin between the three warmest years in Ratpac is small, but 2016 will likely be much warmer, and the warming trend continues unabated through the alleged "no warming period" since 1997.
Here is a UAH v6/Ratpac comparison
Without the distinct trend break in UAH v6 around year 2000 (similar in RSS), the temperatures would have been 0.2-0.3 C warmer today, and likely on record levels..
The transition between MSU and AMSU in UAH v6 occurred between June 1998 and June 2001, and after that the AMSU on NOAA-15 flew alone a full year, before it got company by the Aqua satellite.
Here you can read what Mears et al 2011 are saying about the uncertainty in the merging of the first AMSU TMT onboard NOAA-15.
"[31] Examination of the differences between TMT from MSU channel 2 on NOAA-14 and AMSU channel 5 on NOAA-15 shows a long-term trend difference, with NOAA-15 cooling at a rate of 0.2 K per decade relative to NOAA-14 over the July 1998 to December 2004 period of overlap. This trend difference is not present for the other channel pairs, including, to our surprise, TLT, and is more than 2.5 times larger than the trend difference for any pair of MSU satellites with more than 18 months of overlapping observations. This trend difference is too large to explain using the difference between the MSU and AMSU TMT weighting functions. It is about 100 times larger than the trend difference simulated using HadAT data over the overlap period. The cause is not known and could be a drift in calibration in one or both of the satellites that is not explained by our calibration error model (equation (3)). Since we do not know which satellite is closer to being correct, we treat this drift as an additional source of uncertainty. It is unlikely that the drift is caused by errors in the diurnal adjustment because the magnitude of the drift is similar for land-only and ocean-only averages, which is unlikely to be the case for errors in the diurnal cycle."
If I look at the RATPAC data for the Globe on the surface here, I see there is a huge jump from 0.74 in 2014 to 1.02 in 2015. Why such a huge jump?
Delete+0.28 is much but there are not many stations ( <85) in the Ratpac network, so I believe it is much noisier than the other big surface indices, that probably will finish 0.10-0.15 C up from 2014 to 2015.
DeleteJoeT,
DeleteWell, surface 2015 was a lot warmer than 2014 (global surface 0.13°C). And what you are citing is NH surface, so a rise of 0.28 is not unbelievable. Surface air temp is more volatile than land/ocean, which is stabilised by SST. And I expect Ratpac is weighted toward land.
FWIW, I've been sitting on a post on this till I could get feedback from both Carl Mears and the SkS review team. It's here: http://www.skepticalscience.com/surface_temperature_or_satellite_brightness.html
ReplyDeleteThe RSS ensemble is a key resource for understanding the uncertainties in the satellite reconstruction. Yet I wasn't aware of its availability until I read Carl's AGU abstract and started discussing the implications. A colleague then pointed me to the existing RSS ensemble data.
At least according to my google image fu, I can't find that anyone has plotted the ensemble spread before now. If I had time I'd go through the papers citing Mears (2011) and see if any of them use it. I'll try to get round to looking at the Santer papers at least.
There might be something interesting in PCA of the ensemble but I don't have time to take it on. If you're interested drop me an email.
Just to add: The 2011 Santer paper suggests using the ensemble in future. The 2013 PNAS paper "Human and natural influences on the changing thermal structure of the atmosphere" makes use of the RSS ensemble, e.g. in figure 4 and documented in the supporting information.
DeleteKevin,
DeleteGood article, thanks for that. Yes, the Mears ensemble is a valuable resource. I'm not sure where a PCA of it would lead - it presumably largely reflects the way they set up the ensemble? But I'll look more at it. I've added an update above.
I liked your discussion of uncertainty - the distinction between structural and statistical uncertainty is important. I discussed it here, for surface where spatial uncertainty is also an issue - may also be with RSS. I find it useful to frame the uncertainty as the sample spread from a population, of a notional ensemble. Measurement uncertainty as the spread of replicate measures of the same situation. You can distinguish what might be varied in those measures. Trend uncertainty as the spread you'd get if doing the same calc with the same climate but different weather. Space uncertainty if you measured in different places. Etc.
Kevin, Good work over at SKS. The RSS ensemble is a valuable resource. I also appreciate that you provide the full Hadcrut4 kriging uncertainty ensemble in a single textfile. Thats very convenient for us spreadsheet-only guys that don't easily handle strange file formats. I have used this ensemble to compare with that of RSS. The trend of Hadcrut4 kriging for 1979-2012 is 0.178+/-0.013 with 95% CI. The 85 to 95 percentile of the RSS ensemble trends fall into this interval. For comparison, the radiosonde trends (850-300 hPa 1979-2012)are in the upper third of the RSS ensemble, eg 0.150 C/decade for Ratpac A, 0.156 for Ratpac A v2beta, and 0.178 for the more comprehensive IUK v2
DeleteKevin, in the SKS article it is suggested that the uncertainty in satellite series may grow even larger according to new information from Carl Mears.
Isn't that a pessimistic view?
The methods of Po-Chedley et al 2015 table 3, suggest that the uncertainty can be reduced by half, but to the upper half of theRSS uncertainty interval.
Also, wouldn't it be possible to use radiosonde data for guidance, for example in the very uncertain merging of TMT channels on NOAA-14 and NOAA-15, described in Mears et al 2011 (in my earlier comment above). I suspect that the wrong choice of adjustment have been made here, and caused the trend break at year 2000. The NOAA-15 AMSU channel 5 is likely not reliable here...
Olof: I think you're probably way ahead of me on this. I've only skimmed some of the Po-Chedley papers, and am not at a point where I can comment meaningfully on the research.
Delete(The ensemble was another matter - having already worked with the Hadley ensemble and authors I had a head start on that.)
RE: Po-Chedley And Radiosonde datasets
DeleteI asked Stephen Po-Chedley for a copy of his 2012 MS thesis "Reconciling tropospheric temperature trends from the microwave sounding unit" and he sent me two of his papers instead (both papers were an outcome of that MS thesis AFAIK). I also asked Dr. Zou for an update of the NOAA STAR dataset through 2015-12 (see links in previous post below) which Dr. Zou has now very kindly and timely provided. I did receive a copy of the P-C MS thesis directly from ResearchWorks (it takes 2-3 business days) ...
https://digital.lib.washington.edu/researchworks/handle/1773/20901
Also see this presentation by P-C at a NOAA STAR seminar ...
"RECONCILING TROPOSPHERIC TEMPERATURE TRENDS FROM THE MICROWAVE SOUNDING UNIT"
http://www.star.nesdis.noaa.gov/star/documents/seminardocs/2012/Po-Chedley20120613.pdf
Please remember that this is circa 2012 so you might need earlier versions of RSS and UAH circa 2012 ...
http://data.remss.com/msu/monthly_time_series/old_versions/
http://vortex.nsstc.uah.edu/data/msu/t2/oldversions/
Constrain any trends to the same era (start/stop) for all previous versions and the current version(s) (this should go without saying).
P-C (2015 paper) also has a gridded TMT product (*.nc) for +/-30 degrees here ...
http://www.atmos.uw.edu/~pochedls/nobackup/share/
As to the radiosonde data see this post from Tamino's from a few month's ago (at that point I knew next to nothing about radiosonde data, still don't know a whole lot, so whatever) ...
https://tamino.wordpress.com/2015/06/19/desperate-for-a-pause/
The radiosonde data spatially are heavily concentrated on land, so, IMHO one needs to compare TLT land versus radiosonde data (which is very heavily land based) versus land SAT. We know that the land trends of SAT are higher than either the ocean or combined land+ocean (global) SAT.
Everett, thanks for info and links..
DeleteRegarding RATPAC A, AFAIK it is a globally weighted index, with a fair and balanced representation of different zones, land and sea. I would say that coastal and island stations are overrepresented, so the index has more maritime than continental influence. The longterm trend for Ratpac surface is quite close to that of the global Gistemp dTS rather than the pure land only indices.
A more precise way to compare radiosonde with satellite data is to subsample satellite data in the gridcells where the radiosonde stations are. In that case one have to pick all individual stations from Ratpac B.
This has been explored by Paul S here
The chart show both kind of comparisons. The trendbreak is quite similar with subsampled UAH v6 vs Ratpac B station mean.
Are these two papers by Mears relevant to the comparisons with radiosonde data?
DeleteAssessing Uncertainty in Estimates of Atmospheric Temperature Changes From MSU and AMSU Using a Monte-Carlo Estimation Technique
Assessing the Value of Microwave Sounding Unit-Radiosonde Comparisons in Ascertaining Errors in Climate Data Records of Tropospheric Temperatures
David Sanger,
DeleteKnown and unknown unknowns: uncertainty estimation in satellite remote sensing
http://www.atmos-meas-tech.net/8/4699/2015/amt-8-4699-2015.pdf
From page 4703 ...
"Retrieval parameters and auxiliary data have associated uncertainties. Where the propagation of these is highly non-linear, they can be estimated via ensemble techniques analogous to the NWP approach, as done by Liu et al. (2015). Rather than present an ensemble of retrievals, Mears et al. (2011) produced an ensemble of estimated errors (as perturbations about the measured value presume it is the mean of the true distribution)."
Mears, C. A., Wentz, F. J., Thorne, P., and Bernie, D.: Assessing uncertainty in estimates of atmospheric temperature changes from MSU and AMSU using a Monte-Carlo estimation technique, J. Geophys. Res.-Atmos., 116, 1–16, doi:10.1029/2010JD014954, 2011.
Liu, W., Huang, B., Thorne, P. W., Banzon, V. F., Zhang, H.-M., Freeman, E., Lawrimore, J., Peterson, T. C., Smith, T. M., and Woodruff, S. D.: Extended Reconstructed Sea Surface Temperature Version 4 (ERSST.v4): Part II. Parametric and Structural Uncertainty Estimations, J. Climate, 4, 931-951, doi:10.1175/JCLID-14-00007.1, 2015.
Peter Thorne is the only common author on those two papers.
I would say more on the current rather weak defense (IMHO) of the TLT dataset from Mears and Thorne to date, for example see this video at Tamino's (Mears makes an appearance) ...
https://tamino.wordpress.com/2016/01/14/not-cool/
Good post, Nick.
ReplyDeleteAnd for all, see Kevin C's post, which also includes the flowchart by Mears et al for their satellite processing algorithm.
What could possibly go wrong? :-)
Or course, RSS does not make vast claims about being more accurate than the surface.
I have been backtracking origins of common memes.
Let us recall where and when the “satellites are more accurate” meme started, i.e., part of SkS#38 in fixed list.
Jastrow, Nierenberg, Seitz(1990),
http://www.amazon.com/SCIENTIFIC-PERSPECTIVES-GR--Robert-Jastrow/dp/091546358X Cheap, basically for shipping. Everybody should have one.
pp.95-104 is Spencer and Christy on satellites
That starts:
"Passive microwave radiometry from satellites provides more precise atmospheric temperature information than that obtained from the relatively sparse distribution of thermometers over the earth’s surface. … monthly precision of 0.01C … etc, etc.”
So, they knew this with 10 years experience … which of course doesn’t explain the numerous corrections over the years, and program bugs, etc…
Nick,
ReplyDeleteGreat post as always and excellent comments to boot.
In case anyone wants NOAA STAR global or gridded 1978-10 thru 2015-12 (includes December) Dr. ZoU has updated the integrated global dataset ...
ftp://ftp.star.nesdis.noaa.gov/pub/smcd/emb/mscat/data/MSU_AMSU_v3.0/Monthly_Atmospheric_Layer_Mean_Temperature/Merged_Deep-Layer_Temperature/
ftp://ftp.star.nesdis.noaa.gov/pub/smcd/emb/mscat/data/MSU_AMSU_v3.0/Monthly_Atmospheric_Layer_Mean_Temperature/Global_Mean_Anomaly_Time_Series/
No TLT but TMT, TUT and TLS time series (need to recheck this one versus the 2015-03 release, but that one (2015-03) used a baseline anomaly period of 1998-2007 (i. e. 10-years)).
I'll be using all indices starting from 1979-01 thru 2015-12 (37 complete years), waiting for GISTEMP, Hadley, NOAA and BEST to report out through 2015-12.
At the end of the day the only clarity I need is that the TLT and the SAT metrics are NOT the same thing.
The SAT is essentially a SURFACE measurement, taken within the Earth's surface boundary layer (some people don't seem to realize this for some rather odd reason), while the TLT is a volumetric metric of several km thickness (coming nowhere near the Earth's surface in reality of the satellite instrumentation limitations, specifically MSU/AMSU), a proxy measurement of atmospheric temperature and appears to be unduly contaminated due to assumed weighting functions that may include too much of the upper troposphere and lower stratosphere).
Nick, if you find the time, please read these two posts:
ReplyDeletehttps://okulaer.wordpress.com/2015/12/23/why-gistemp-loti-global-mean-is-wrong-and-hadcrut3-gl-is-right/
https://okulaer.wordpress.com/2016/01/07/uah-v6-vs-ceres-ebaf-toa/
Earth’s Energy Imbalance
Deletehttp://journals.ametsoc.org/doi/pdf/10.1175/JCLI-D-13-00294.1
Climate variability and relationships between top-of-atmosphere radiation and temperatures on Earth
http://onlinelibrary.wiley.com/doi/10.1002/2014JD022887/full
https://www.researchgate.net/profile/John_Fasullo/publication/275243335_Climate_variability_and_relationships_between_top-of-atmosphere_radiation_and_temperatures_on_Earth_Variations_in_temperatures_and_radiation/links/553ab2c10cf245bdd7644860.pdf
Top-of-atmosphere Radiation Budget and Global Mean Sea Surface Temperature
https://staff.aist.go.jp/s.taguchi/AMS2015-556v2.pdf
Not even wrong.
Not even wrong what? Your papers don't even address the points made in my links ... So I'm afraid if anyone's "not even wrong", it's you.
Deleteokulaer,
DeleteI think your first post is awfully long, and muddled. You contend that GISS is wrong, and something made up of HADCRUT 3 with a downshift in 1997 is right. And naturally, that shows a handsome pause. And naturally I don't agree - I calculate the TempLS index myself using adjusted or unadjusted data, and it agrees very well with GISS.
It's an adventurous claim, and you need ot be much more upfront with the basis for it. You get to Fig 2, which clims that HAD3 is a good match for GISS 60S-60N post 1997 (with maybe a shift). So? It's not so surprising - as Cowtan and Way showed, a large part of the reason why HADCRUT lags is because of poor coverage of the Arctic. But that isn't a knock on GISS.
And somehow you argue that the Arctic shouldn't be allowed to make a difference. This I just can't follow. The fact is, it does. There is endless stuff around lately of people saying that the surface readings are wrong, and satellites or something prove it. That is what this post is about.
As to your claim:
"And, regarding temps at least, the Arctic and the Antarctic have tended to pull in opposite directions, offsetting each other’s influence rather than reinforcing it."
you give no quantification, and it just isn't true. I showed those graphs here.
The stuff on GISS deleting icy SST needs detail. I believe it is wrong. SST datasets usually give the temp where there is sea ice as -1.8°C. That is the freezing point of sea water, but has no use as a proxy for air temperature above ice pack. GISS rightly enters it as no reading - I do too. Otherwise there is a totally artificial effect on the trend - it is zero there beaause the freezing point doesn't change. But the air does.
As for the rest, well, I'm afraid it just goes on too long.
As to your plots of UAH vs Ceres OLR, seeking to justify the change to V6, well, I didn't think the correlations were all that good. But it's useless for that justifying purpose unless you also show the correlation with V5.6.
A truly bizarre gish gallop posting. Ends with this:
Delete"Well, they managed for quite some time. But after the continued upward adjustments at the hands of GISS over the last few years, squeezing out another +0.03K of their 2001-2015 trend, even H4 can no longer fully follow “GISTEMP LOTI global mean” on its soaring path towards the sky, as can be witnessed in Fig. 21 above."
It does not help your conclusion when you use woodfortrees where the latest value hadcrut4 is May 2015.
Better use this one:
http://www.moyhu.blogspot.com.au/p/latest-ice-and-temperature-data.html#Drag
One observation from there is the close correspondence between Hadcrut4 and TempLSgrid and between Gisstemp and TempLSmesh.
I agree with Nick and Ehak, Gistemp loti, Hadcrut4 kriging, BEST land/ocean, and TempLSmesh, all indices with kriging or other methods of infill, follow each oher remarkably well.
DeleteOf course, everyone is free to produce indices for 60 S-60 N only, but if you compare apples to oranges, you can not expect them to be similar..
Ehak, back on topic.. I have noticed that you are a frequent commenter over at Roy Spencers blog, kudos for that..
DeleteNext time, ask him what happens if he switches the UAH TMT-channel to NOAA STAR TMT in the UAH v6 TLT formula: LT = 1.538*MT -0.548*TP +0.01*LS
Actually, if one is allowed to freely combine all available channel temperature series out on the market, the UAH v6 TLT formula has wiggle-room enough to produce trends from 0.070 to 0.187 C/decade for the full satellite era. This interval is quite similar to the 90% uncertainty interval of RSS TLT, which is 0.075-0.189 C/dec for 1979-2012.
Here is a chart chart with the largest possible trend alternative and the original UAH v6 TLT. (To solely replace the TMT-channels also produce 0.187, the difference disappears by rounding)
Similarly, if the RSS TTT-product (T = 1.1*TMT - 0.1*TLS) is recombined with free choices, it can produce trends from 0.092 to 0 0.165 C/decades for 1979-2015.
Very interesting.
DeleteI tried a RSS-version of UAH v6 or TMLT. I only used the RSS channel 3. Their channel 3 starts i 1987. The UAH channel 3 is more or less reconstructed before 1987. The RSS TMLT compared to RSS TLT:
http://i.imgur.com/RB12NFS.png
Close.
Then I did a STAR TMLT compared to RSS TMLT:
http://i.imgur.com/5pUHsUA.png
I believe Star is using the diurnal drift from RSS. The series are very close up to 1999. And after 2001. It looks like the Star intersatellite calibration in the MSU/AMSU transition makes the difference. The diurnal drift correction from UAH gives higher temperatures to the end of the series than RSS. Po-Chedley's diurnal drift correction in combination Star's intersatellite calibration gives even higher trend.
Wrong legend for the second graph. Again STAR TMLT vs RSS TMLT:
Deletehttp://i.imgur.com/fRrFYQT.png
Nick,
ReplyDeleteYou say "SST datasets usually give the temp where there is sea ice as -1.8°C". I'm not sure I really understand what you mean. But what is true is that GISS uses land station to extrapolate temperature above sea ice. Okulaer seems (indeed your post is quite long...), citing Bob Tisdale, to find it creates a warming bias for global temperature.
There's another way of interpreting temp above sea ice : using SST in open water near sea ice. That's what have done Berkeley Earth. The result is that global temp is just as high as with land used as a proxy for sea ice. Both datasets show record warming for the end of 2015. (http://berkeleyearth.lbl.gov/auto/Global/Land_and_Ocean_complete.txt)
Kevin,
DeleteI see that HADSST3 mostly sets sea ice areas to -9999 (NA). But ERSST, which GISS now uses, does not. It sets them to -1.8°C. At the N Pole, it's -1.8 every month of the year. Bob Tisdate, in okulaer's link, objects to GISS disregarding this "data", even while quoting Hansen's very sensible explanation. I think from memory that OiSST v2 does the same.
Interpolating the N Pole from nearest land is obviously a stretch. But it's more realistic than -1.8.
Nick, sorry. I just realized KC is initials for Kevin Cowtan but I'm not Kevin who's commenting on you blog. Anyway, I'll change it to prevent any confusion. Let's say I'm Keri.
DeleteSo If I follow you, that means everywhere you have sea ice, air temp is estimated to be -1,8°C. Because sea ice is a huge area (7% of the globe), I think it's not possible...It's maybe just a way to show something instead of NA. Indeed interpolating from land is maybe better.
In general, I think it would be a good thing to look deeper into this sea ice problem, examining different datasets
Keri (sorry about name confusion),
Delete"It's maybe just a way to show something instead of NA. Indeed interpolating from land is maybe better."
Yes, I think that is right. For my part, I wish they wouldn't, because a few data points probably are genuinely close to -1.8, which makes filtering hard. People do look deeper into the sea ice problem.
The latest from tamino. Quite convincing.
ReplyDeletehttps://tamino.wordpress.com/2016/01/15/drift/
Cabc
Cross posting at Tamino and Rabett...
ReplyDeleteThe difference between 5.6 and 6 has to do with the fact that UAH USED to do this — “UAH does not yet correct the diurnal drift for satellites carrying Advanced Microwave Sounding Units because they attempt to use these satellites during periods when the diurnal drift is small.”
http://www.theguardian.com/environment/climate-consensus-97-per-cent/2015/mar/25/one-satellite-data-set-is-underestimating-global-warming
Now they are using a diurnal drift correction – but this got them closer to the RSS than to the CRUtemp…
So there is something affecting the diurnal drift, if eliminating it effectively gets rid of the problem.
respectfully bjchip
I've followed the NOAA Star analysis of MSU/AMSU data for some time. It's independent of UAH and RSS and has some interesting corrections. They had been working on a TLT product for some time and when I emailed to ask if there had been any developments, Dr. Zou pointed out that they actually have a product, but it is AMSU only, and runs from 1998 until 2011. He says that he'd like to update and extend it but lack of resources prevents this. In any case, for 1998 to 2011, this would serve as another point of comparison, especially since this is the time where the other analyses diverge from the radiosondes and surface. This data is here:
ReplyDeleteftp://ftp.star.nesdis.noaa.gov/pub/smcd/emb/mscat/data/AMSU_v1.0/AMSUA_only_Monthly_Layer_Temperature_1998-2012_Previous_version/
Yes, I've been reading more since they were mentioned along with UAH and RSS in the NOAA 2015 report. I do get the impression that they are rather thinly resourced. I notice the disclaimer"
Delete"Data and images hosted on the STAR webservers are not official NOAA operational products, and are provided only as examples for experimental use by remote sensing researchers, experienced meteorologists, or oceanographers. Although STAR provides "operational" data for some products, the STAR website primarily hosts examples of ongoing experimental product development. STAR pages and data sources may therefore be interrupted, changed, or canceled at any time without notice. STAR websites are not managed to meet operational data standards of uptime or redundant operations."
I found their theoretical basis document here. It seems rather incomplete.
Interesting stuff, cce
DeleteThey don't have a TLT product yet, only data for the separate AMSU channels. However, I would say that AMSU channel 4 is almost a pure TLT in itself. According to Figure 5 in the PDF
ftp://ftp.star.nesdis.noaa.gov/pub/smcd/emb/mscat/data/AMSU_v1.0/AMSUA_only_Monthly_Layer_Temperature_1998-2012_Previous_version/AMSUA.TCDR.Figures.pdf
the trend of channel 4 is 0.12 C/ decade for the period 1998 through 2011, and that is way more than for any operative TLT product.
The heart of TLT:s, the AMSU channel 5 seems to suffer from the usual "hiatus"
problem. The trend is much lower than expected from an interpolation between channel 4 and 6.
I have to correct myself, the trend of AMSU channel 4 (0.120) is not much larger than that of UAH 5.6 TLT (0.106). Why is UAH 5.6 not affected by the suspected drift in AMSU channel 5 (TMT)? Can it be that the lack of diurnal drift correction for AMSU:s in that product compensates for the other "mysterious" drift?
DeleteAnother question is if the channel 5 drift is solely in NOAA-15, which has been in active service during the whole AMSU period. I am not sure how to interpret figure 2 in the pdf above, it suggests that there are drifts in the difference between NOAA-15 and all other AMSU satellites.
One should also remember that Mears et al 2011 noted that the difference in trend (0.2) between the TMT:s of NOAA-14 (last MSU) and NOAA-15 (first AMSU) was the single largest intersatellite uncertainty, and they had no clue which one that was right.
Well, I suggest that NOAA-15 channel 5 is wrong, and all other satellites are right. Validatons by radiosondes, reanalysis, AMSU channel 4, surface temperature indices, and other temperature related indices, support this statement. UAH v6 and RSS TLT trends diverge from everything else during the last 17 years..
Olof: Agree. When everything else disagree, there is very slim reasons not to conclude AMSU on NOAA-15 has a wrong diurnal drift correction. There might of course be other biases. I believe (that is: I think I remember) that UAH5.6 did not have a diurnal drift correction because they used the non-drifting Aqua. When the Aqua AMSU could no longer be used, they reintroduced a diurnal drift correction.
DeleteA smoking gun for me in this is the divergence between land-stations and TLT land:
http://i.imgur.com/ZuQwe76.png
Diurnal drift corrections have most effect over land. And no: I do not think the land stations can poosibly have such a big warming bias after 2000.
Ehak, UAH v6 TLT and RSS TLT are misfits over oceans as well, not with each other, but with all other indices, defined by the lack of trend during the AMSU-era.
DeleteDr. Zou described their AMSU-A Channel 4 product as a TLT series. He abandoned attempts to create a "limb view" TLT product similar to UAH or RSS which he considers problematic.
DeleteThe paper describing this is here:
http://search.ebscohost.com/login.aspx?direct=true&profile=ehost&scope=site&authtype=crawler&jrnl=07390572&AN=95574453&h=GR6AOTLK%2BhHv6q5qWZh5s7etynENG%2F1JFUxoBiMkxG73iHidEa1EDSE1n2TI5maCNtGrdaQRU5TCSf4JOrRyhQ%3D%3D&crl=c
If that link doesn't work, the third link in this Google scholar search should give you an unpaywalled copy.
https://scholar.google.com/scholar?cluster=17248613196060531813&hl=en&as_sdt=0,27
I think I read that the guy who made that land by thermometer may not even read the papers of the guy who made this one.
ReplyDelete