GISS has posted its March estimate for global temperature anomaly, and it has risen from 0.45°C in February to 0,70°C in March. That balances the drop from January to February.
The TempLS comparison is murky this month, because of GHCN errors that I described here, here and here. My original estimate was a rise of 0.27°C, but after correcting a sign reversal at Sarh in Chad, that rose to 0.31°C. Then I found that NORD ADB in Greenland had September data instead of march; removing that brought the estimate back to 0.23°C. Then I found that other Greenland stations were also affected, and removing them all made the final estimate also a rise of 0.25°C. But I had little faith in it.
The comparison maps are below the jump.
Here is the GISS map. It shows no sign of the Chad problem, which they must have fixed. But it does show high values in Greenland.

And here, with the same scale and color scheme, is the earlier TempLS map:
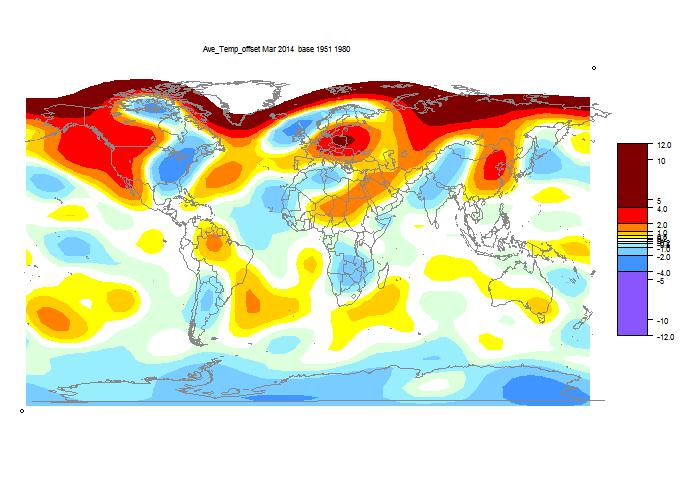
GISS was gererally warmer, more so especially in Asia, but less in W N America. I think TempLS was cool because of an adjustment I made because my new scheme for simple harmonics wasn't getting the anomaly base right. I think I have a proper fix for this now. The TempLS map also had the artificially high Greenland data.
Previous Months
FebruaryJanuary 2014
December
November
October
September
August
July
June
May
April
March
February
January
December 2012
November
October
September
August
July
June
May
April
March
February
January
December 2011
November
October
September
August 2011
More data and plots


The GISS 250km map for March shows they didn't use any Greenland data - the anomalies there are solely due to interpolation. I don't think they used the Chad data either.
ReplyDeleteMy guess was going to be that their own automated QC systems picked up these errors and rejected the data. However, I just noticed their station data tool states that they use the 'qca' data as input rather than 'qcu' you use. I wonder if these errors were picked up when processing the 'adjusted' dataset but not the 'adjusted'.
Yes, I would expect that. These are massive inhomogeneities and any program that tries to homogenise should fix them. It's possible that the QCA file itself fixed them. But if so, there should be a process for extreme inhomogeneities to flag the items in QCU.
DeleteThe QCU and the CLIMAT forms are supposed to be tightly coupled. But clearly for Greenland they weren't.
* not the 'unadjusted'.
ReplyDeleteNick, this becomes an interesting sensitivity test of the effects of erroneous data on the outcome, especially when the erroneous data are in regions with few stations.
ReplyDeleteAs a side question, do you go back and recalculate your old monthly values? I'd guess you'd see some change of values, as more data flows in and old erroneous data points get gradually corrected.
Carrick,
DeleteYes, it is ai interesting sensitivity test. In the case of the SH map, the sensitivity increases greatly with the number of basis functions - basically, if you aim for higher frequency resolution, then things can go more haywire.
On your side question, I recalculate the values each month, based on the current data files (for all months), and these are reflected in the table on the latest data page. But I don't change the posted estimates, so you can see how updated data affects them. So when I said, this month, that the temp was up from 0.305°C in Feb, I had earlier reported 0.287°C for Feb. You can find the same with GISS, though they wisely give just 2 sig fig.
For some of the months, you were only reporting the change in temperature for TempLS, which makes it a bit clumsier to do (if the format were the same, I could scrape the data from the webpages).
ReplyDeleteAnyway, I suspect you'll see three effects. One is change of values due to QC, the second is the addition of slow reporting stations and the third is changes in your algorithm. I was curious whether there was a monthly effect on the mean shift between two series and whether the shifts were larger for more recent years (the assumption being that newer points are more likely to be modified than old ones).
But changing some points in a particular station series can modify others depending on how the adjustment software works (the effect can be nonlocal), so it gets complicated to work out in practice how an update in a value in a station's time series propagates through the estimate for global mean temperature.
I happen to have the February 2010 global GISTEMP data, so I could compare it to the series four years later. Interestingly there are some effects on trend as well. I suspect this is partly due to changes in the underlying series used (e.g. ERSST versus HadSST2 and GHCN v2 versus GHCN v3).
If you look at the PSD of the difference between those two series, there are strong spectral peaks at 1-year, 1/2 year and 1/3 year, which I would have expected as well as a big peak around 2-years (probably ENSO).
Anyway, here is the rms change, 1950-2000 for GISTEMP by month. There's a pretty systematic variation by months:
1 0.026
2 0.032
3 0.030
4 0.031
5 0.034
6 0.029
7 0.037
8 0.039
9 0.037
10 0.030
11 0.028
12 0.027
I was exactly backwards---I would have expected DJF to have larger updates than JJA.
I'm sure there are actual papers on this, but it's always interesting to look at the raw data on your own.
The columns are calendar month and detrended RMS temperature (°C).
DeleteCarrick,
DeleteThanks for that. Oddly, in Feb 2010 I was writing about reporting cycles for GHCN stations. I still have files from then.
I give the list of links to my past monthly GISS reports at the bottom of each monthly post. I think each of those (there are 31) reports the temperature first posted by GISS.
There was a noticeable change to GISS when they moved to GHCN V3 sometime after September 2010 (in fact Dec 2011). They scrapped their own homogenization and went with GHCN QCA.
Thanks for that explanation on dates of the switch to GHCN V3.
DeleteI should have mentioned in my list of possible causes of changes in the historical temperatures, switching the data sets.