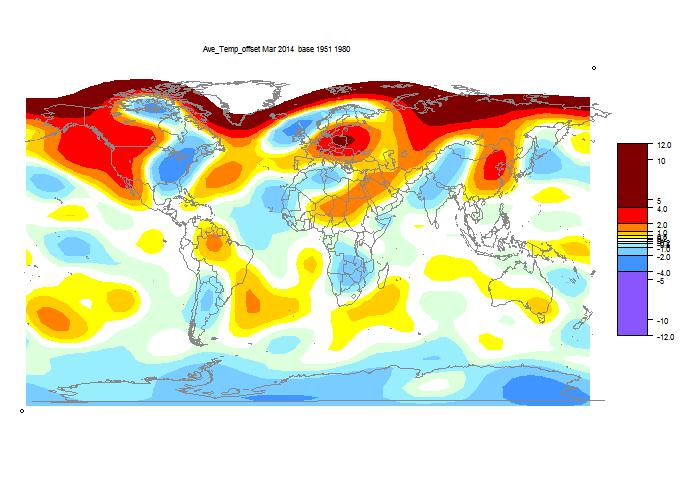
TempLS showed a large rise from February to March, more than balancing the large drop to February. The global average anomaly rose from 0.305°C to
0.616°C. The satellite indices showed little movement.
Update 11/4. As you'll see below the jump, there has been a little excitement this month, caused by what seems to be an error in GHCN. I originally posted a rise of 0.27°C and showed a plot with a huge cool spot in Central Africa. It turns out that FORT-ARCHAMBAULT Lat 9.10 Lon 18.40 is in GHCN as having a -31.6°C average in March. This station reports infrequently, but March 1998 and 1999 were both 31.5°C. Looks like a sign error. Assuming that, the global mean rises by 0.04°C, and the cold spot in the map goes away. This place is influential because there's not much other data in the region.
Update; Here is the CLIMAT form submitted by Chad for Sarh (formerly FORT-ARCHAMBAULT). It shows -31.6°C.
Here is the spherical harmonics plot of the temperature distribution. I've made some changes this month. I used a different and I think better scheme for truncating to a finite basis set. That seems to let me get better resolution, so I have resumed showing the polar regions as well. I have also improved the color matching with GISS.
Update 11/4: As mentioned originally below, there is a big cold spot over central Africa, which looks like an artefact. I have reverted to the old scheme, and in the revised plot below, lowered the resolution. It doesn't go away. A commenter pointed to a reanalysis which showed nothing much in central Africa, but some cool in the Sahara; maybe that, combined with the lack of stations in the area, is causing the problem. None of this affects the calculated monthly averages - it is a spherical harmonics (used for graphics) issue. See next.
Update: Problem solved, I think. It's a GHCN error. I now have the March 2014 station-based HTML5 plot showing, and there are just a few cool stations in central Africa. But you can display the anomalies, and one of them, FORT-ARCHAMBAULT Lat 9.10 Lon 18.40, has an anomaly of -37.84°C! That caused the spherical harmonics to go haywire.
In the original data, this equatorial place had a March average of -31.6°C. Probably a sign error.
It will also have reduced the global average by a small amount.

It was again cold in N America, but the spectacular cold spot was in central Africa. This may be an artefact (Update - error in GHCN, see above). Below is the map of the 4255 stations reporting to date. That is a fair total, but as the map shows, reports from central Africa are sparse. The natural suspicion is that I've pushed the resolution too far, but the cold spot shows at lower resolution. And I've used the revised method to recalculate previous months, with good results. We'll see what GISS says.
It was very warm in Europe and northern Asia.
Update 12 Apr: I've had to modify the plot (slightly) because the new SH routine wasn't setting the anomaly base correctly. Again, the global average is unaffected.

Update: Another apparent GHCN error. The station of NORD ADS, 81°N in Greenland, is shown with a monthly mean of 4.3°C. It's normally about -30 in March. I checked the CLIMAT forms, but OGIMET says Greenland hasn't submitted any in March.


It is certainly an artifact, see reanalysis:
ReplyDeletehttp://i62.tinypic.com/25pjpme.png
Yes, Anom, that is quite convincing. In the morning, I'll re-do the calc in the old style, and then try to figure out why this apparent improvement is unstable.
Deleteps the monthly average should not be affected. I have not changed anything there.
Delete