The general layout of the file is easy to use. They mix the inventory data with the temperatures, which takes some sorting out. For some reason, they give negative longitudes.
On station numbers, here is a plot of how they have varied since 1900. There is not much very recent data - it fades about 2007-8. This plot shows stations that reported at least once in each year.
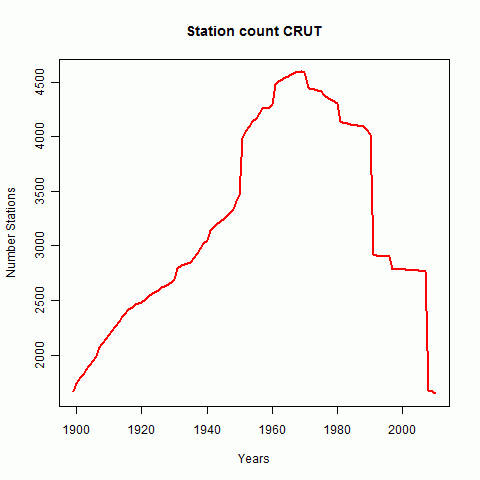
Heere is a graph showing recent data better. It is of course heavily influenced here by the GHCN history.
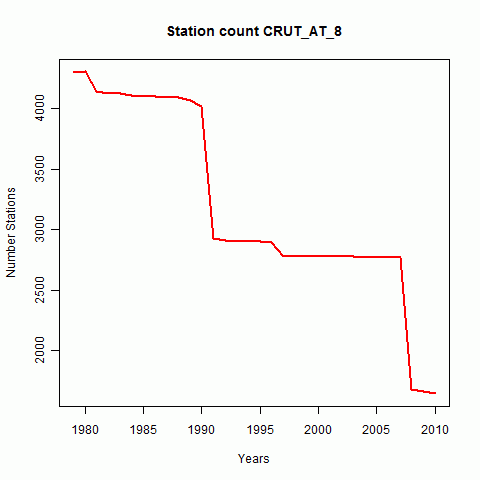
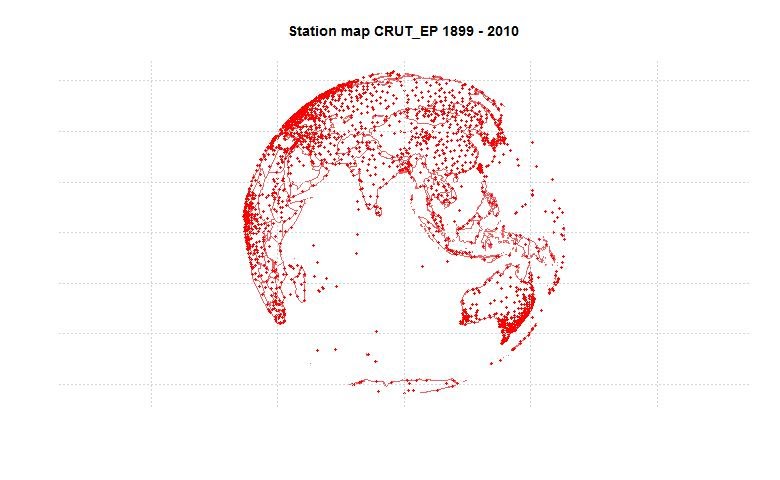
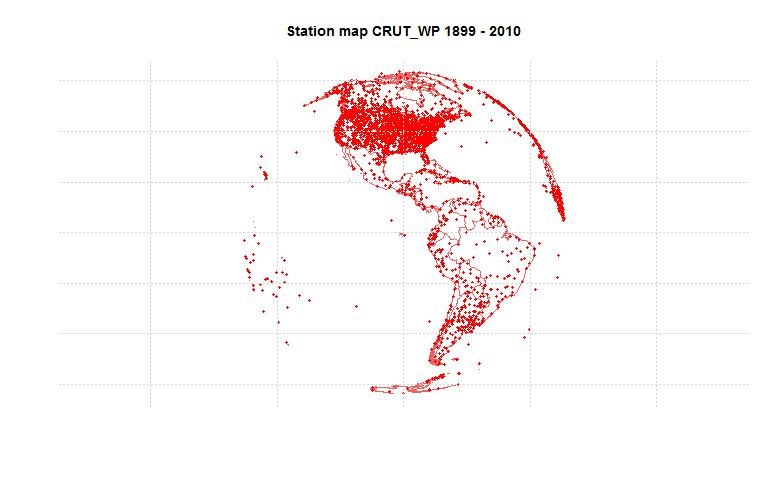
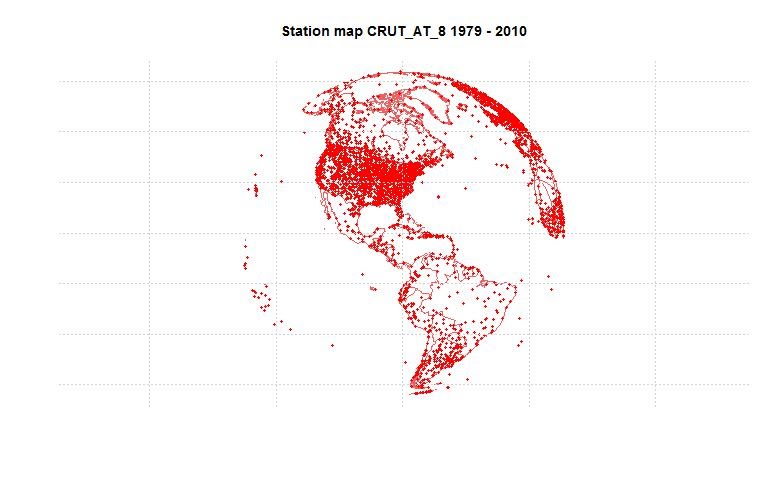
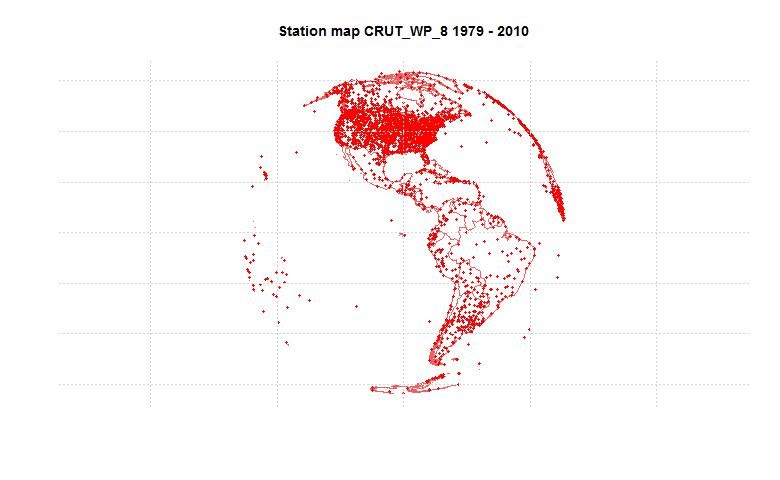
Now I'll show station maps from various perspectives. First a set of stations that have reported some time since 1900:
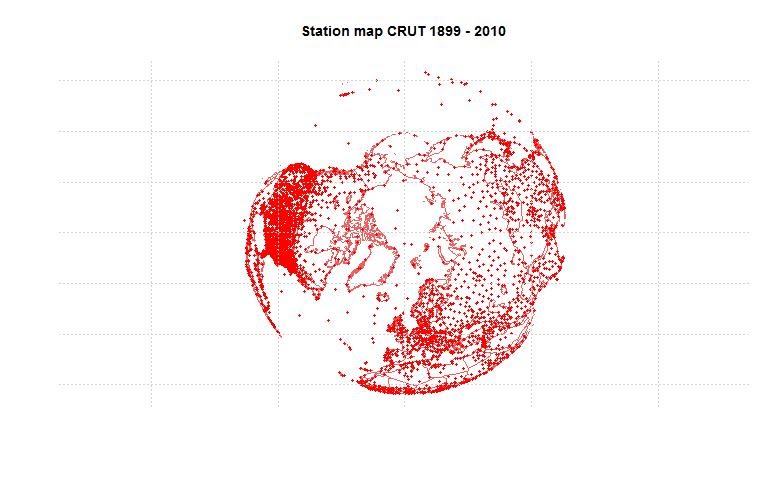
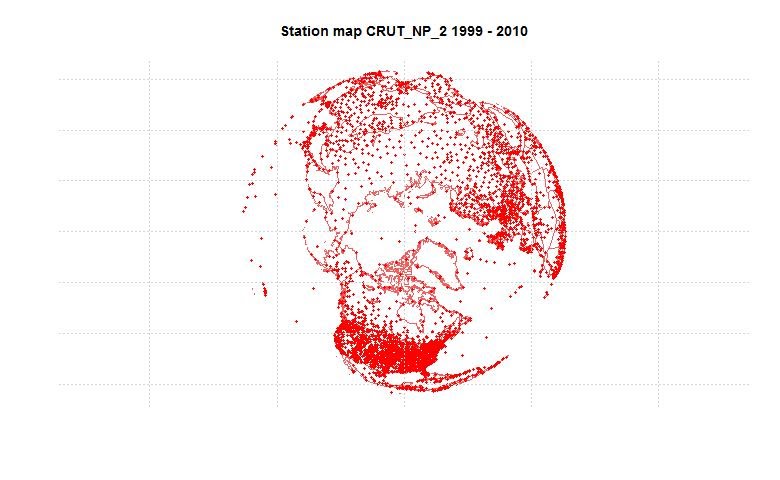
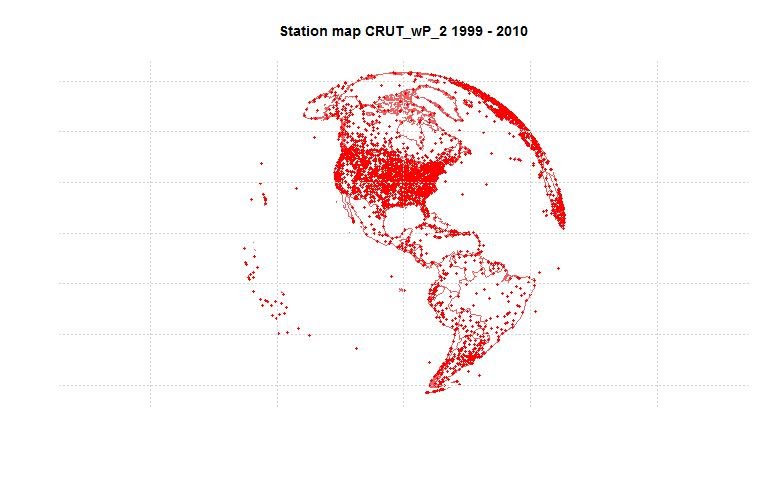
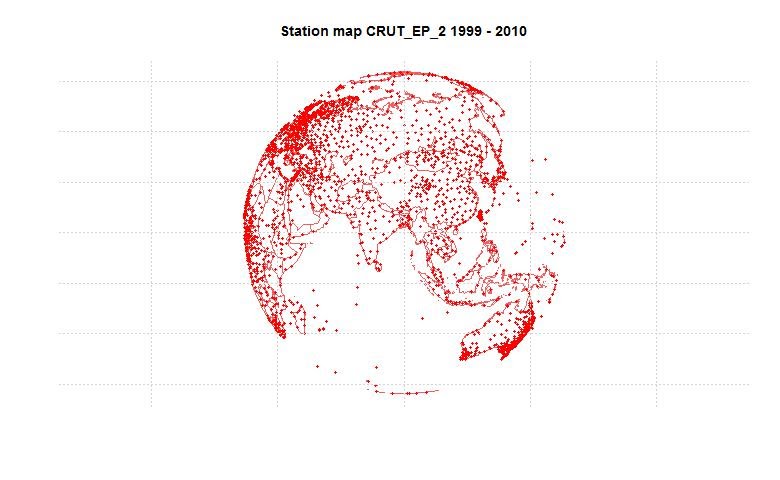
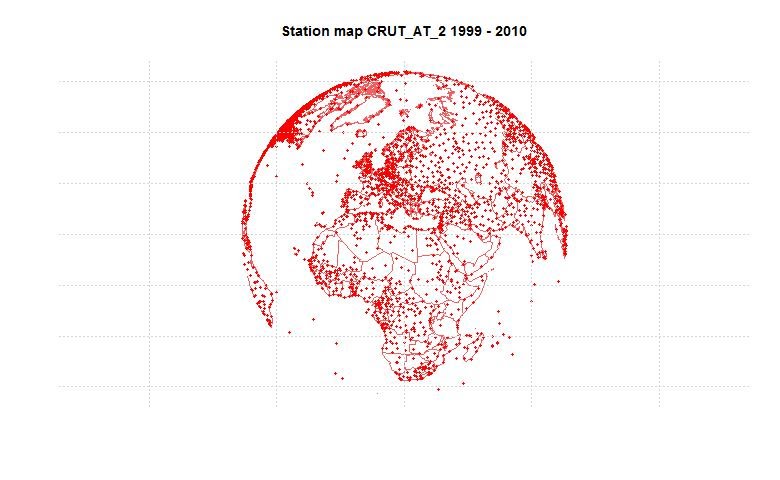
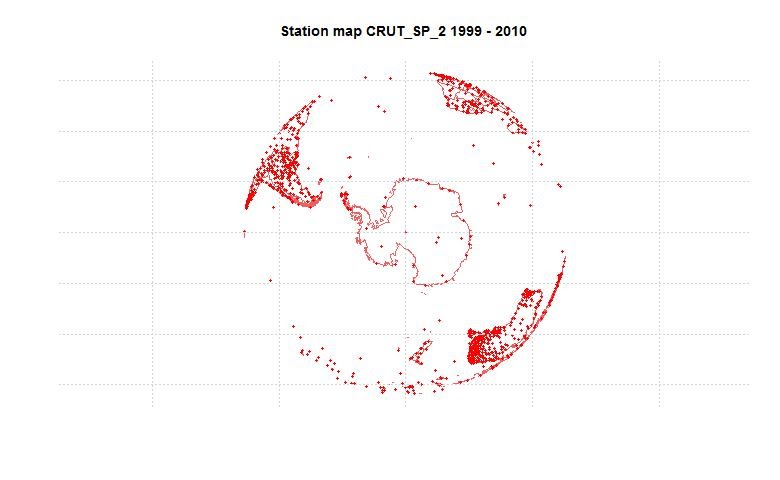
Now looking at stations that have reported since 2000:
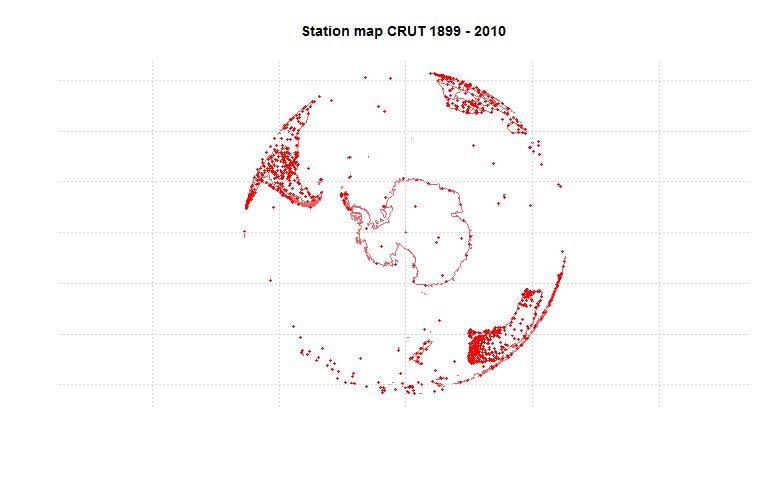
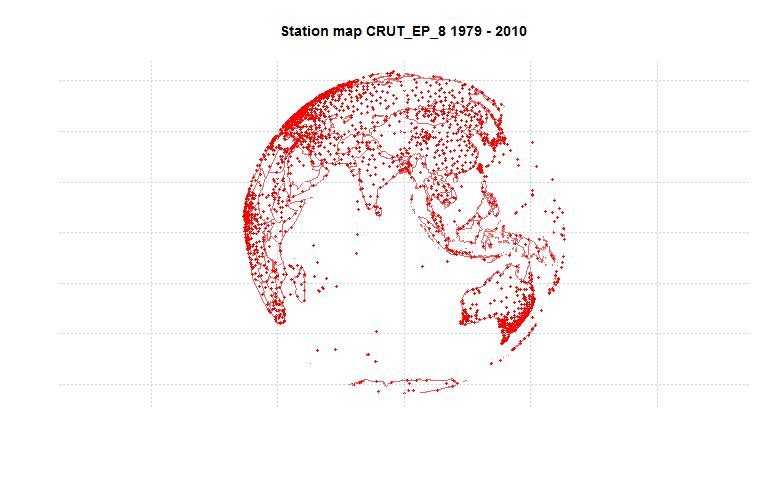
Finally, a look at station that have reported since 1980:


0 comments:
Post a Comment