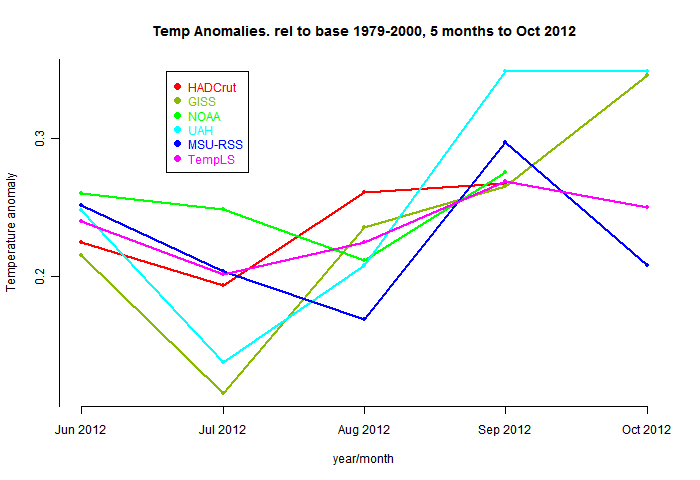
Anyway, that encouraged to do something that I tried last year - putting up the latest sea ice and global temperature numbers. But then I did it manually and it got to be a drag. Now I'm hoping I can fully automate it, using R as well. So here's a start. (Though Neven has the full ice story).
The automation mainly consists of an embedded html window in which the numbers will appear. I'm planning to run the script at least once a day, and about 1.30pm Japan time, when the JAXA ice numbers appear. It will check for the latest Had/UAH etc numbers. New numbers will appear bolded or colored. And the graphs will be updated.
Update: Some data for this post has gone missing, but it's done much better now in the latest data page.
So below the jump are firstly the numbers - small tables of recent results immediately visible, but larger tables if you scroll down. Then come the graphs.
Sources: JAXA, HADCRUT3, GISS, UAH T2LT, RSS MSU, NOAA,
JAXA Sea Ice Extent for dates close to present 
|
JAXA Sea Ice Extent to present and for full year 
|
Major temperature indices - last 12 months 
|
Major temperature indices - last 4 years 
|


Rather than the globals how about N of 60 degrees?
ReplyDeleteEli,
ReplyDeleteThat's a long way from home for me :)
It would be of interest, but I don't know where I can find monthly maintained files. The satellites have it, tho UAH is >64N. NOAA doesn't, GISS doesn't, and I'm not sure about CRU.
But you've got me thinking. I could probably tweak TempLS to do it.
Ask Neven
ReplyDeleteCheck out the KNMI climate explorer. It will allow you to get >64 for every one. It is a great resource. Has pretty much everything...
ReplyDelete