The GISS V4 land/ocean temperature anomaly was 0.93°C in January 2022, up from 0.86°C in December. This rise is similar to the 0.08°C increase (now 0.068°C) reported for TempLS.
As usual here, I will compare the GISS and earlier TempLS plots below the jump.
Wednesday, February 16, 2022

Monday, February 7, 2022
January global surface TempLS up 0.08°C from December.
The TempLS mesh anomaly (1961-90 base) was 0.724°C in January, up from 0.644°C in December. That makes it the fifth warmest January in the record. The NCEP/NCAR reanalysis base index fell by 0.06°C.
The most prominent feature is the cold in NE N America, and the warmth almost everywhere in Eurasia. In fact most of the land area was warm, except for the Sahara and Antarctica.
You may notice that Moyhu had another hiatus in December/January, which caused me to miss the annual summary. I won't try to catch up there at this stage. There may be other gaps during the year, but Moyhu will return.
Here is the temperature map, using the LOESS-based map of anomalies.
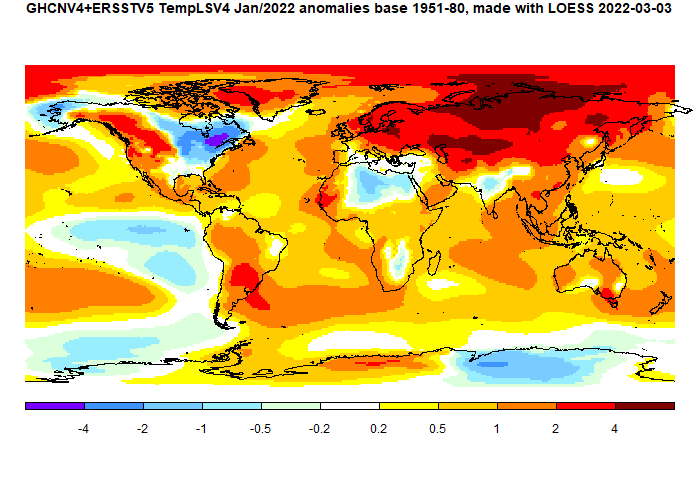
As always, the 3D globe map gives better detail.
The most prominent feature is the cold in NE N America, and the warmth almost everywhere in Eurasia. In fact most of the land area was warm, except for the Sahara and Antarctica.
You may notice that Moyhu had another hiatus in December/January, which caused me to miss the annual summary. I won't try to catch up there at this stage. There may be other gaps during the year, but Moyhu will return.
Here is the temperature map, using the LOESS-based map of anomalies.
As always, the 3D globe map gives better detail.
Sunday, November 14, 2021
GISS October global temperature up by 0.07°C from September.
The GISS V4 land/ocean temperature anomaly was 0.99°C in October 2021, up from 0.92°C in September. This rise is less than the 0.114°C increase (now 0.13°C) reported for TempLS.
As usual here, I will compare the GISS and earlier TempLS plots below the jump.
As usual here, I will compare the GISS and earlier TempLS plots below the jump.
Saturday, November 6, 2021
October global surface TempLS up 0.114°C from September.
The TempLS mesh anomaly (1961-90 base) was 0.903°C in October, up from 0.789°C in September. It was the second warmest October in the record, just ahead of 2019 and just behind 2015. Either of those rankings could change with further data. The NCEP/NCAR reanalysis base index rose by 0.064°C.
The most prominent feature is the warmth in N Canada and adjacent Arctic.
There was a cool band from Central Europe through to central Asia, and Antarctica and W USA were also also cool.
Here is the temperature map, using the LOESS-based map of anomalies.

As always, the 3D globe map gives better detail.
The most prominent feature is the warmth in N Canada and adjacent Arctic.
There was a cool band from Central Europe through to central Asia, and Antarctica and W USA were also also cool.
Here is the temperature map, using the LOESS-based map of anomalies.
As always, the 3D globe map gives better detail.
Wednesday, November 3, 2021
NCEP/NCAR global temperature index up 0.064°C in October
I no longer post regular reports on my NCEP/NCAR reanalysis index, but since Moyhu is in catch up mode, it seems a good time to note the significant rise that has happened in the three months that I have been away:

This is more marked than what is shown by the surface measures, and makes October comparable with the warm months of 2020.
I should also note that, possibly since Feb 2020 (leap year), there has been an error in the dating of my published results here; the dates shown were a day behind. The fault sometimes became obvious as when July 1 became June 31. Anyway I think it is fixed now.
This is more marked than what is shown by the surface measures, and makes October comparable with the warm months of 2020.
I should also note that, possibly since Feb 2020 (leap year), there has been an error in the dating of my published results here; the dates shown were a day behind. The fault sometimes became obvious as when July 1 became June 31. Anyway I think it is fixed now.
Tuesday, November 2, 2021
TempLS global temperatures for July, August and September
Moyhu is back, and there is some catching up to do. The usual temperature post for October will appear soon. But to maintain continuity, although it is old news, here are the TempLS results for the three missing months, together with the GISS comparisons.
First, here is the graph usually shown here, which shows the comparison between TempLS and others in that time, to a common base

Nothing surprising; all datasets are in agreement except for UAH, with TempLS and GISS particularly close. The actual numbers for those months are shown here. Below are the maps of temperature, shown as usual using the GISS colors and base period:
Next I'll post a catch-up on the NCEP/NCAR daily data.
First, here is the graph usually shown here, which shows the comparison between TempLS and others in that time, to a common base
Nothing surprising; all datasets are in agreement except for UAH, with TempLS and GISS particularly close. The actual numbers for those months are shown here. Below are the maps of temperature, shown as usual using the GISS colors and base period:
| TempLS | GISS |
July |
 |
August |
 |
September |
 |
Next I'll post a catch-up on the NCEP/NCAR daily data.
Thursday, July 15, 2021
Moyhu hiatus
I'll need to be away from my computer for a few months, so I won't be blogging much. In particular, the latest data page will probably be irregularly updated, if at all. Sorry about that, it will resume.
Subscribe to:
Posts (Atom)


 Posts
Posts

