I posted recently on flutter in GHCN adjustment. This is the tendency of the Pairwise Homogenisation Algorithm (PHA) to produce short-term fluctuations in monthly adjustments. It arose on a recent discussion of the kerfuffle of John Bates and the Karl 2015 paper, and has been investigated by Peter O'Neill, who is currently posting on the topic. In my earlier post, I looked at the distribution of individual month adjustments, and noted that with generally zero mean, they would be heavily damped on averaging.
But I was curious about the mechanics, so here I compare the same two adjusted files (June 2015 and Feb 9 2017) collected by station. I'll show a histogram, but more interesting is the spatial distribution shown on a trackball sphere map. The histogram shows a distribution of station RMS values tapering rather rapidly toward 1°C. The map shows the flutter is strongly associated with remoteness, especially islands.
Update: I have now enabled clicking to show not only the name of the nearest station, but the RMS adjustment change there in °C. I have also adopted William's suggestion about the color scheme (white for zero, red for large).
Monday, February 13, 2017

Friday, February 10, 2017
January global surface temperature up 0.155°C.
TempLS mesh rose significantly in January, from 0.66°C to 0.815°C. This follows the earlier very similar rise of 0.13°C in the NCEP/NCAR index, and rises in the satellite indices, including a 0.18°C rise in the RSS index. January was the warmest month since April, and as with NCEP/NCAR, it was warmer (in anomaly) than any month before October 2015.
TempLS grid also rose by 0.12°C. I think this month temperatures were not greatly affected by the poles. The breakdown plot was interesting, with contributions to warmth from N America, Asia, Siberia and Africa, with Arctic also warm as usual lately.
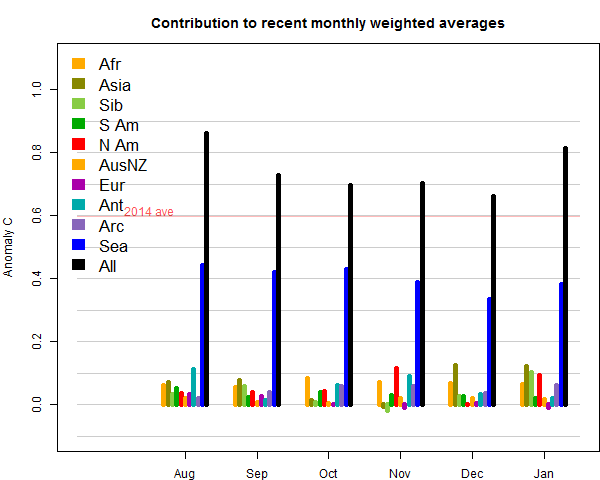
TempLS grid also rose by 0.12°C. I think this month temperatures were not greatly affected by the poles. The breakdown plot was interesting, with contributions to warmth from N America, Asia, Siberia and Africa, with Arctic also warm as usual lately.
Thursday, February 9, 2017
Flutter in GHCN V3 adjusted temperatures.
In the recent discussion of the kerfuffle of John Bates and the Karl 2015 paper, the claim of Bates that the GHCN adjustment algorithm was subject to instability arose. Bates claim seemed to be of an actual fault in the code. I explained why I think that is unlikely, but rather it is a feature of the Pairwise Homogenisation Algorithm (PHA).
GHCN V3 adjusted is issued approximately daily, although it is not clear how often the underlying algorithm is run. It is posted here - see the readme file and look for the qca label.
Paul Matthews linked to his analysis of variations in Alice Springs adjusted over time. It did look remarkable; fluctuations of a degree or more over quite short intervals, with maximum excursions of about 3°C. This was in about 2012. However Peter O'Neill had done a much more extensive study with many stations and more recent years (and using many more adjustment files). He found somewhat smaller variations, and of frequent but variable occurrence.
I don't have a succession of GHCN adjusted files available, but I do have the latest (downloaded 9 Feb) and I have one with a file date here of 21 June 2015. So I thought I would look at differences between these to try to get an overall picture of what is going on.
GHCN V3 adjusted is issued approximately daily, although it is not clear how often the underlying algorithm is run. It is posted here - see the readme file and look for the qca label.
Paul Matthews linked to his analysis of variations in Alice Springs adjusted over time. It did look remarkable; fluctuations of a degree or more over quite short intervals, with maximum excursions of about 3°C. This was in about 2012. However Peter O'Neill had done a much more extensive study with many stations and more recent years (and using many more adjustment files). He found somewhat smaller variations, and of frequent but variable occurrence.
I don't have a succession of GHCN adjusted files available, but I do have the latest (downloaded 9 Feb) and I have one with a file date here of 21 June 2015. So I thought I would look at differences between these to try to get an overall picture of what is going on.
Friday, February 3, 2017
NCEP/NCAR January warmest month since April 2016.
The Moyhu NCEP/NCAR index at 0.486°C was warmer than any month since April 2016. But it was a wild ride. It started very warm, dropped to temperatures lower than seen for over a year, rose again, and the last two weeks were very warm, and it still is. The big dip coincided with the cold snap in E North America, and in Central and East Europe, extending through Russia. Then N America warmed a little, although some of Europe stayed cold, and there was the famous snow in the Sahara. Overall, Arctic and Canada (despite cold snaps) were warm, as was most of Asia. Europe and the Sahara were indeed cold.
I'll note just how warm it still is, historically. I don't make too much of long term records in the reanalysis data, since it can't really be made homogeneous. But January was not only warmest since April, but warmer (by a lot) than any month prior to October 2015.
UAH satellite, which dropped severely in December, rose a little, from 0.24°C to 0.30°C. Arctic sea ice, which had been very low, recovered a bit to be occasionally not the lowest recorded for the time of year. Antarctic ice is still very low, and may well reach a notable minimum.
With the Arctic still warm, I would expect a substantial rise for GISS and TempLS mesh, with maybe less for HADCRUT and NOAA.
I'll note just how warm it still is, historically. I don't make too much of long term records in the reanalysis data, since it can't really be made homogeneous. But January was not only warmest since April, but warmer (by a lot) than any month prior to October 2015.
UAH satellite, which dropped severely in December, rose a little, from 0.24°C to 0.30°C. Arctic sea ice, which had been very low, recovered a bit to be occasionally not the lowest recorded for the time of year. Antarctic ice is still very low, and may well reach a notable minimum.
With the Arctic still warm, I would expect a substantial rise for GISS and TempLS mesh, with maybe less for HADCRUT and NOAA.
Wednesday, February 1, 2017
Homogenisation and Cape Town.
An old perennial in climate wars is the adjustment of land temperature data. Stations are subject to various changes, like moving, which leads to sustained jumps that are not due to climate. For almost any climate analysis that matters, these station records are taken to be representative of some region, so it is important to adjust for the effect of these events. So GHCN publishes an additional list of adjusted temperatures. They are called homogenised with the idea that as far as can be achieved, temperatures from different times are as if measured under like conditions. I have written about this frequently, eg here, here and here.
The contrarian tactic is to find some station that has been changed and beat the drum about rewriting history, or some such. It is usually one where the trend has changed from negative to positive. Since adjustment does change values, this can easily happen. I made a Google Maps gadget here which lets you see how the various GHCN gadgets are affected, and posted histograms here. This blog started its life following a classic 2009 WUWT sally here, based on Darwin. That was probably the most publicised case.
There have been others, and their names are bandied around in skeptic circles as if they were Agincourt and Bannockburn. Jennifer Marohasy has for some reason an irrepressible bee in her bonnet about Rutherglen, and I think we'll be hearing more of it soon. I have a post on that in the pipeline. One possible response is to analyse individual cases to show why the adjustments happened. An early case was David Wratt, of NIWA on Wellington, showing that the key adjustment happened with a move with a big altitude shift. I tried here to clear up Amberley. It's a frustrating task, because there is no acknowledgement - they just go on to something else. And sometimes there is no clear outcome, as with Rutherglen. Reykjavik, often cited, does seem to be a case where the algorithm mis-identified a genuine change.
The search for metadata reasons is against the spirit of homogenisation as applied. The idea of the pairwise algorithm (PHA) used by NOAA is that it should be independent of metadata and rely solely on numerical analysis. There are good reasons for this. Metedata means human intervention, with possible bias. It also inhibits reproducibility. Homogenisation is needed because of the possibility that the inhomogeneities may have a bias. Global averaging is very good at suppressing noise(see here and here), but vulnerable to bias. So identifying and removing possibly biased events is good. It comes with errors, which contribute noise. This is a good trade-off. It may also create a different bias, but because PHA is automatic, it can be tested for that on synthetic data.
So, with that preliminary, we come to Cape Town. There have been rumblings about this from Philip Lloyd at WUWT, most recently here. Sou dealt with it here, and Tamino touched on it here, and an earlier occurrence here. It turns out that it can be completely resolved with metadata, as I explain at WUWT here. It's quite interesting, and I have found out more, which I'll describe below the jump.
The contrarian tactic is to find some station that has been changed and beat the drum about rewriting history, or some such. It is usually one where the trend has changed from negative to positive. Since adjustment does change values, this can easily happen. I made a Google Maps gadget here which lets you see how the various GHCN gadgets are affected, and posted histograms here. This blog started its life following a classic 2009 WUWT sally here, based on Darwin. That was probably the most publicised case.
There have been others, and their names are bandied around in skeptic circles as if they were Agincourt and Bannockburn. Jennifer Marohasy has for some reason an irrepressible bee in her bonnet about Rutherglen, and I think we'll be hearing more of it soon. I have a post on that in the pipeline. One possible response is to analyse individual cases to show why the adjustments happened. An early case was David Wratt, of NIWA on Wellington, showing that the key adjustment happened with a move with a big altitude shift. I tried here to clear up Amberley. It's a frustrating task, because there is no acknowledgement - they just go on to something else. And sometimes there is no clear outcome, as with Rutherglen. Reykjavik, often cited, does seem to be a case where the algorithm mis-identified a genuine change.
The search for metadata reasons is against the spirit of homogenisation as applied. The idea of the pairwise algorithm (PHA) used by NOAA is that it should be independent of metadata and rely solely on numerical analysis. There are good reasons for this. Metedata means human intervention, with possible bias. It also inhibits reproducibility. Homogenisation is needed because of the possibility that the inhomogeneities may have a bias. Global averaging is very good at suppressing noise(see here and here), but vulnerable to bias. So identifying and removing possibly biased events is good. It comes with errors, which contribute noise. This is a good trade-off. It may also create a different bias, but because PHA is automatic, it can be tested for that on synthetic data.
So, with that preliminary, we come to Cape Town. There have been rumblings about this from Philip Lloyd at WUWT, most recently here. Sou dealt with it here, and Tamino touched on it here, and an earlier occurrence here. It turns out that it can be completely resolved with metadata, as I explain at WUWT here. It's quite interesting, and I have found out more, which I'll describe below the jump.
Tuesday, January 31, 2017
A guide to the global temperature program TempLS
TempLS is an R program that I have been running for some years at Moyhu. It computes a land/ocean temperature average in the style of Gistemp, HADCRUT or NOAA (see Wiki overview) In this post, I want to collect links to what I have written about it over the years, describe the methods, code and reporting, and something about the graphics. I'll then promote it to a maintained page. I'll start with a Table of Contents with links:
Friday, January 27, 2017
Global anomaly spatial sampling error - and why use anomalies?
In this post I want to bring together two things that I seem to be talking a lot about, especially in the wake of our run of record high temperatures. They are
The way to think about stated uncertainties is that they represent the range of results that could have been obtained if things had been done differently. And so the question is, which "things". This concept is made explicit in the HADCRUT ensemble approach, where they do 100 repeated runs, looking at each stage in which an estimated number is used, and choosing other estimates from a distribution. Then the actual spread of results gives the uncertainty. Brohan et al 2006 lists some of the things that are varied.
The underlying concept is sampling error. Suppose you conduct a poll, asking 1000 people if they will vote for A or B. You find 52% for A. The uncertainty comes from, what if you had asked different people? For temperature, I'll list three sources of error important in various ways:
1. Measurement error. This is what many people think uncertainties refer to, but it usually isn't. measurement errors become insignificant because of the huge number of data that is averaged. measurement error estimates what could happen if you had used different observers or instruments to make the same observation, same time, same place.
2. Location uncertainty. Ths is dominant for global annual and monthly averages.You measured in sampled locations - what if the sample changed? You measured in different places around the earth? Same time, different places.
3. Trend uncertainty, what we are talking about above. You get trend from a statistical model, in which the residuals are assumed to come from a random distribution, representing unpredictable aspects (weather). The trend uncertainty is calculated on the basis of, what if you sampled differently from that distribution? Had different weather? This is important for deciding if your trend is something that might happen again in the future. If it is a rare event, maybe. But it is not a test of whether it really happened. We know how the weather turned out.
So here I'm talking about location uncertainty. What if you had sampled in different places. And in this exercise I'll do just that. I'll choose subsets of 500 of the USHCN and see what answers we see. That is why USHCN is chosen - there is surplus information from the dense coverage.
So the spatial error is reduced by a factor of 8, to an acceptable value. The error of temperature alone, at 0.201, was quite unacceptable. But anomalies perform even better with area-weighting, which should always be used. Here I calculate state averages and then area-weight the states (as USHCN used to do):
Update: I had implemented the area-weighting incorrectly when I posted about an hour ago. Now I think it is right, and the sd's are further reduced, although now the absolute improves by slightly more than the anomalies.
For both absolute T and anomalies, the mean has gone up, but the SD has reduced. In fact T improves by a slightly greater factor, but is still rather too high. The anomaly sd is now very good.
Does the anomaly base matter? A little, which is why WMO recommends the latest 3 decade period. I'll repeat the last table with the 1951-90 base:
The T average is little changed, as expected. The small change reflects the fact that sampling 1000 makes the results almost independent of that random choice. But the anomaly mean is higher, reflecting warming. And the sd is a little higher, showing that subtracting a slightly worse estimate of the 2011 value (the older base) makes a less homogeneous set.
- What is the main component of the error that is quoted on global anomaly average for some period (month, year)? and
- Why use anomalies? (an old perennial, see also GISS, NOAA)
Using anomalies
I have been finding it necessary to go over some essentials of using anomalies. The basic arithmetic is- Compute some "normal" (usually a 30-year period time average for each month) for each station in the network,
- Form local anomalies by subtracting the relevant normal from each reading
- Average the anomalies (usually area-weighted)
Coverage error - spatial sampling error for the mean.
Indices like GISS and HADCRUT usually quote a monthly or annual mean with an uncertainty of up to 0.1°C. In recent years contrarians have seized on this to say that maybe it isn't a record at all - a "statistical tie" is a pet phrase, for those whose head hurts thinking about statistics. But what very few people understand is what that uncertainty means. I'll quote here from something I wrote at WUWT:The way to think about stated uncertainties is that they represent the range of results that could have been obtained if things had been done differently. And so the question is, which "things". This concept is made explicit in the HADCRUT ensemble approach, where they do 100 repeated runs, looking at each stage in which an estimated number is used, and choosing other estimates from a distribution. Then the actual spread of results gives the uncertainty. Brohan et al 2006 lists some of the things that are varied.
The underlying concept is sampling error. Suppose you conduct a poll, asking 1000 people if they will vote for A or B. You find 52% for A. The uncertainty comes from, what if you had asked different people? For temperature, I'll list three sources of error important in various ways:
1. Measurement error. This is what many people think uncertainties refer to, but it usually isn't. measurement errors become insignificant because of the huge number of data that is averaged. measurement error estimates what could happen if you had used different observers or instruments to make the same observation, same time, same place.
2. Location uncertainty. Ths is dominant for global annual and monthly averages.You measured in sampled locations - what if the sample changed? You measured in different places around the earth? Same time, different places.
3. Trend uncertainty, what we are talking about above. You get trend from a statistical model, in which the residuals are assumed to come from a random distribution, representing unpredictable aspects (weather). The trend uncertainty is calculated on the basis of, what if you sampled differently from that distribution? Had different weather? This is important for deciding if your trend is something that might happen again in the future. If it is a rare event, maybe. But it is not a test of whether it really happened. We know how the weather turned out.
So here I'm talking about location uncertainty. What if you had sampled in different places. And in this exercise I'll do just that. I'll choose subsets of 500 of the USHCN and see what answers we see. That is why USHCN is chosen - there is surplus information from the dense coverage.
Why use anomaly?
We'll see. What I want to show is that it dramatically reduces location sampling error. The reason is that the anomaly set is much more homogeneous, since the expected value everywhere is more or less zero. So there is less variation in switching stations in and out. So I'll measure the error with and without anomaly formation.USHCN example
So I'll look at the data for the 1218 stations in 2010, with an anomaly relative to the 1981-2010 average. In a Monte Carlo style, I make 1000 choices of 500 random stations, and find the average for 2011, first by just averaging station temperatures, and then the anomalies. The results (in °C) are:| Base 1981-2010, unweighted .. | Mean of means .. | s.d. of means |
| Temperatures | 11.863 | 0.201 |
| Anomalies | 0.191 | 0.025 |
So the spatial error is reduced by a factor of 8, to an acceptable value. The error of temperature alone, at 0.201, was quite unacceptable. But anomalies perform even better with area-weighting, which should always be used. Here I calculate state averages and then area-weight the states (as USHCN used to do):
Update: I had implemented the area-weighting incorrectly when I posted about an hour ago. Now I think it is right, and the sd's are further reduced, although now the absolute improves by slightly more than the anomalies.
| Base 1981-2010, area-weighted .. | Mean of means .. | s.d. of means |
| Temperatures | 12.102 | 0.137 |
| Anomalies | 0.101 | 0.016 |
For both absolute T and anomalies, the mean has gone up, but the SD has reduced. In fact T improves by a slightly greater factor, but is still rather too high. The anomaly sd is now very good.
Does the anomaly base matter? A little, which is why WMO recommends the latest 3 decade period. I'll repeat the last table with the 1951-90 base:
| Base 1951-80, area-weighted .. | Mean of means .. | s.d. of means |
| Temperatures | 12.103 | 0.138 |
| Anomalies | 0.620 | 0.021 |
The T average is little changed, as expected. The small change reflects the fact that sampling 1000 makes the results almost independent of that random choice. But the anomaly mean is higher, reflecting warming. And the sd is a little higher, showing that subtracting a slightly worse estimate of the 2011 value (the older base) makes a less homogeneous set.
So what to make of spatial sampling error?
It is significant (with 500 station subsets) for anomaly, and the reason why large datasets are sought. In terms of record hot years, I think there is a case for omitting it. It is the error if between 2015 and 2016 the set of stations had been changed, and that happened only to a very small extent. I don't think the theoretical possibility of juggling the station set between years is an appropriate consideration for such a record.Conclusion
Spatial sampling, or coverage error for anomalies is significant for ConUS. Reducing this error is why a lot of stations are used. It would be an order of magnitude greater without the use of anomalies, because of the much greater inhomogeneity, which is why one should never average raw temperatures spatially.
Subscribe to:
Posts (Atom)


 Posts

