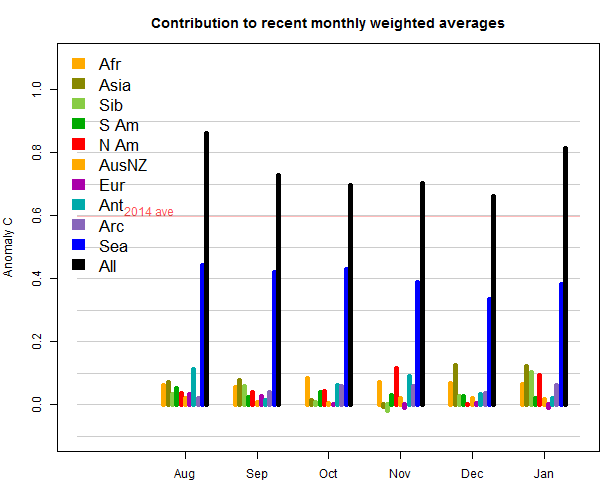
TempLS grid also rose by 0.12°C. I think this month temperatures were not greatly affected by the poles. The breakdown plot was interesting, with contributions to warmth from N America, Asia, Siberia and Africa, with Arctic also warm as usual lately.

The main map features are big blobs of warmth over about Mongolia, N Canada, and some over the Sahara (despite the snow stories). Cold in Europe and Brazil.

The TempLS post was a little late this month. For some reason automatic download of ERSST didn't work. I'll have to figure a new system. In other news, February has made a very warm start in the NCEP/NCAR index.
Update: When I came to write the GISS report, I saw that the temperature had come back almost 0.06°C (while still agreeing quite well with GISS). That is an unusual change, and I wondered why. You can compare the graphs here and there; the difference is that the hotspot over Mongolia is much reduced, and the cold spot over Amazon has gone away. I think part of that is spherical harmonics behaviour. However, the Asia hotspot had quite a lot of data supporting it - I don't know if that has been amended. The most obvious reason for the change is that when I posted here, Turkey and Saudi Arabia had not reported. Both were cold.


0 comments:
Post a Comment