Looking further, it turns out that calculating with V4 gave a rise of 0.04°C, closer to the finding of others. But he was inclined to emphasise the difference, leading up to a striking tweet in which he said that transition from V3 to V4 was responsible for a 0.2°C discrepancy. So maybe that needs more attention.
An extra oddity came when his post was reposted at GWPF, where their spin was that "The global averaged surface temperature for June 2019 was 0.62C, back down to where it was before the 2015/16 El Nino" or, on Twitter, "Global Temperature Falling Again". This was rightly mocked on Twitter.
So, I ran TempLS again with V3, unadjusted and adjusted. It isn't clear to me which version Clive was using. But I regularly use unadjusted, and I think this gives the best guide to the changes in the dataset, as opposed to the effect of homogenisation.
The first thing to say is that I did get a very small change with V3, at 0.004°C rise. That is about 0.063°C less than with V4, a similar difference to Clive. As we'll see that is a moderately large discrepancy by past experience, although not an outlier. Anyway, let's see some graphs.
Clive's first graph was monthly data from about 1998. So in my first plot, I'll cover that range, using unadjusted GHCN, along with ERSST V5:

I've marked the trends over the period. There are some deviations in the early part, but very close later. This contrasts with Clive's claim of a growing discrepancy. Here is the last decade in more detail:

Again the V4 has lower trend, but starts a little higher, converging to be almost exactly equal at the end. You can see best in this plot that is discrepancy in June is unusual recently, but not unprecedented, and such differences were more common around 2012.
The final plot was of annual averages going back to about 1975. Here is my version:

This does now show some divergence in mid-range, with a slightly higher trend for V4. But I do think that all these differences are well within the range of chance variation. You can't expect the addition of so many stations to give exactly the same result.
For comparison with Clive's outcome here is his version of that last plot, with the late discrepancy:

You can see that even Clive's V3 result makes a mockery of thw GWPF claim that we are back to where we were before the 2016 El Nino.
Anyway, I'll look at the same plots using adjusted GHCN V3 and V4. Here is the 2 decades of monthly:

It's very close at the recent end, but there is now a higher trend for V4 relative to V3. The last decade:

Again, close at the end. Now the trend has V3 higher than V4, although V4 is offset higher, reflecting accumulated trend since 1961-90. But the end difference of the trend lines is only about 0.02°C.
So finally the annual since 1975 (which is the mid-point of the anomaly base period):
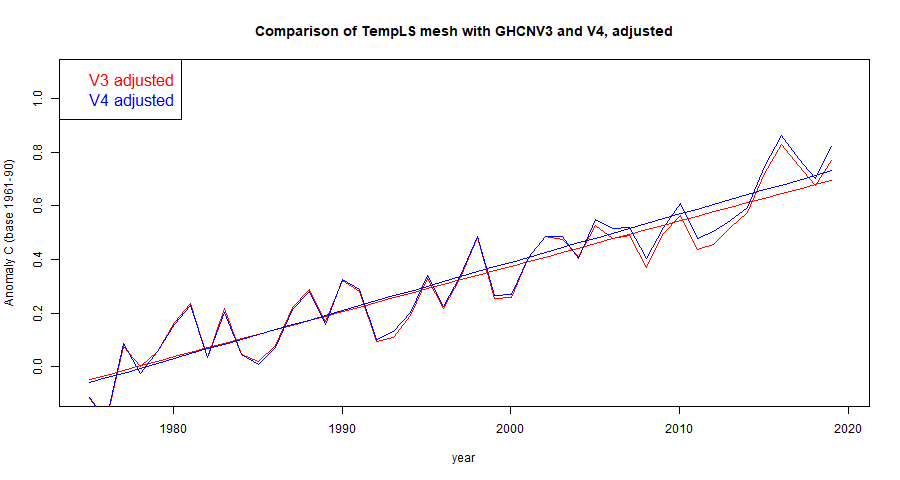
V4 has the higher trend. The trend lines pretty much have to start at zero in 1975, because of the anomaly base.
Here is a table of the trend values shown. I have shown with red the cases where the V4 trend is higher than V3.
| Trend units: °C/Decade | GHCN V3 | GHCN V4 |
| Unadjusted | ||
| 1998-2019 | 0.372 | 0.352 |
| 2010-2019 | 0.206 | 0.197 |
| 1975-2019 | 0.174 | 0.178 |
| Adjusted | ||
| 1998-2019 | 0.376 | 0.361 |
| 2010-2019 | 0.187 | 0.202 |
| 1975-2019 | 0.169 | 0.18 |
Conclusion
I think there is little systematic difference, and based on the unadjusted data, no basis for saying that the new stations have skewed the trends. And certainly no claim for a 0.2°C discrepancy. As for his June value of 0.62°C, I get, with the same basis, 0.725°C.Update I have put the full set of anomalies dating back to Jan 1900 on a zip file (with readme) here.
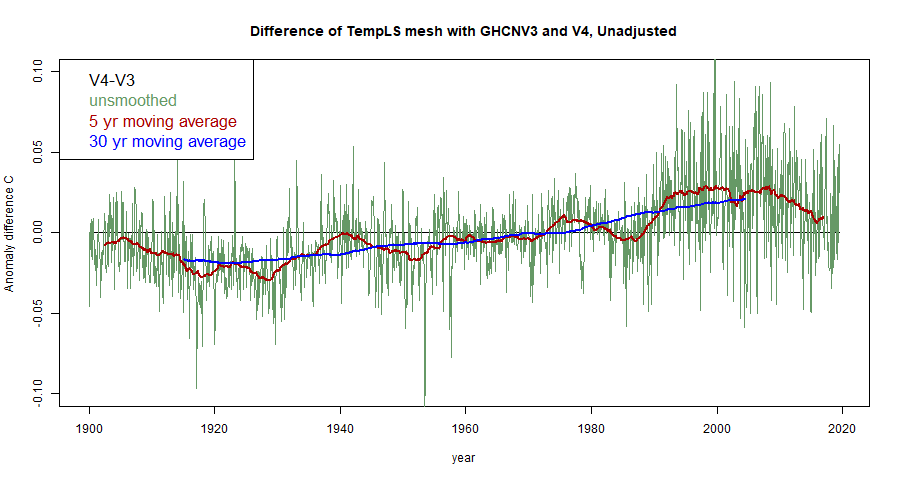
Update I have also plotted the differences, V4-V3, since 1900, for unadjusted vs adjusted. The overall trends are 0.0037C/decade for unadjusted and 0.0026C/decade for adjusted. Very small.


Thanks for doing this Nick.
ReplyDeleteThe 0.2C was a mistype. It should have been 0.02C !
What I am concerned about is the diverging of the annual anomaly between V3C and V4C after 2004. The gap is seems systematic and increasing.
The other differences are insignificant.
Clive,
DeleteI've added some difference plots, similar to the one you tweeted. There is a difference of about 0.02°C toward the end. It is diminishing for unadjusted, not so much for adjusted. The overall trends of difference are very small but positive.
Your last plot confirms what I said above.
ReplyDeleteThis was something pointed out in the early days of ISTI.
ReplyDeleteFunnily enough, I see Nick himself commented on that post.
I wonder if it might be informative to take a look at a trend difference map on 1998-2018 and see how much of the difference is due to the suppression of Arctic warming by PHA in v3?
ReplyDeleteSee:
https://iopscience.iop.org/article/10.1088/1748-9326/aafd4e/meta?fbclid=IwAR33PZyfCpLBXOTwY70fsZdWknzTiQOlBsjIbi2TxWI6XXTV-nvSQDfx3a0
http://www-users.york.ac.uk/~kdc3/papers/coverage2013/update.140404.pdf
Thanks, Kevin,
DeleteActually, that is my current project. I was planning to map the differences in June, where there is a divergence. I'd like to track it down. The mechanical difficulty is that I can't do a direct plot with the mesh methods, since the meshes are different. LOESS would be ideal, with icosahedral nodes, but I've been doing GHCNV3 with TempLS V3, which doesn't have LOESS. So I've been getting GHCN V3 to work with TempLS V4. That should be very easy, but I've had to put in some extra infrastructure to cope with V4 adding new stations (V3 never did).
Anyway, it's working now, so I'll be able to do graphic differences of both months (June) and trend periods. Postr coming soon.
GHCN seem to have gone out of their way to make life almost impossible to locate original V3 stations that appear within V4. Their IDs have changed dramatically. So for example
ReplyDeleteV3 10160566000 32.3800 3.8200 450.0 GHARDAIA
V4 AGXLT477883 32.4000 3.8000 520.0 GHARDAIA
V3 Readme says: ' ID: 11 digit identifier, digits 1-3=Country Code, digits 4-8 represent the WMO id if the station is a WMO station. It is a WMO station if digits 9-11="000".'
V4 Readme says : 'ID: Station identification code. First two characters are FIPS country code'
Sometimes you can find a WMO ID but mostly stations have an undisclosed numbering system. Does anyone know the answer to the mystery?
I had a nice reply from Jared Rennie (NOAA).
Delete85% of GHCN-Monthly V4 originate from our daily product, known as GHCN-Daily. We used the same ID structure as them.. The remaining 15% come from a different source outside of GHCN-Daily, and a GHCN-Daily like ID needs to be applied (for consistency). In doing this, we attempted to search for information that can help us build the id (country of origin, WMO ID match, station location, etc). In the cases where it could not be found, we needed a process to build the ID.
So, for this Baku station, the "AJ" indicates its from Azerbaijan, and "XLT" indicates we weren't able to find a match using our criteria. The remaining numbers are a unique identifier randomized, so there would be no duplicate id's. This process isn't perfect, but was a way at the time to try and build a consistent ID system.
So V4 has no connection with V3. It seems to have been generated mainly by taking the monthly averages of GHCN-Daily. If I do a direct search for V3 WMO IDs embedded in V4 IDs, I only find 2432 ! I don't understand why as they must V3 stations must be contained inside V4, but suspect somehow the WMO ID has changed.
So part of the mystery is resolved. V4 has nothing to do with V3. It is mainly the monthly averages of GHCN-Daily and adopts their ID system. I know that GHCN-Daily contains component stations as well as merged stations at the same location. Their search system to identify WMO stations based on Lat, Lon and station name seems fairly often to fail due to long/short names and number of decimal points in the coordinates (see GHARDAIA above).
Thanks for reporting, Clive
DeleteIt is indeed a helpful reply (tho I think the station is in Algeria).
I wonder if those 2432 are US stations?