I think that now that TempLS and GISS are using GHCN V4, the agreement will be even better than in the past, as in this month. There extra coverage does make a difference. The earlier NCEP/NCAR average also agreed very well (0.19° rise). It was the third highest March in the record, just behind 2017.
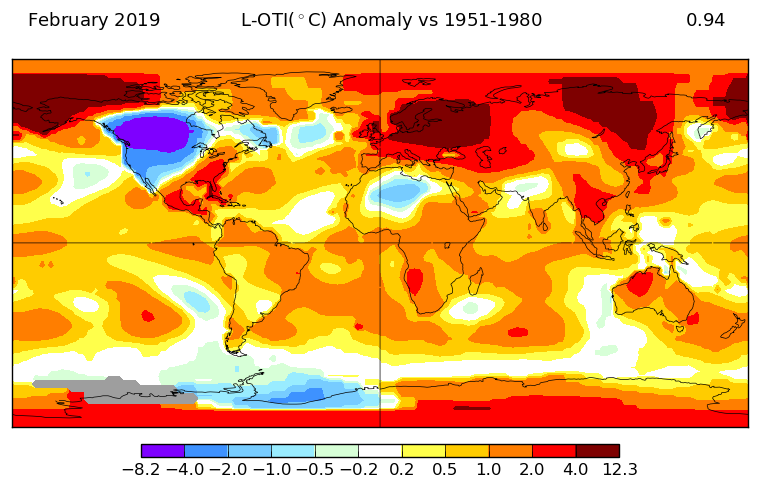
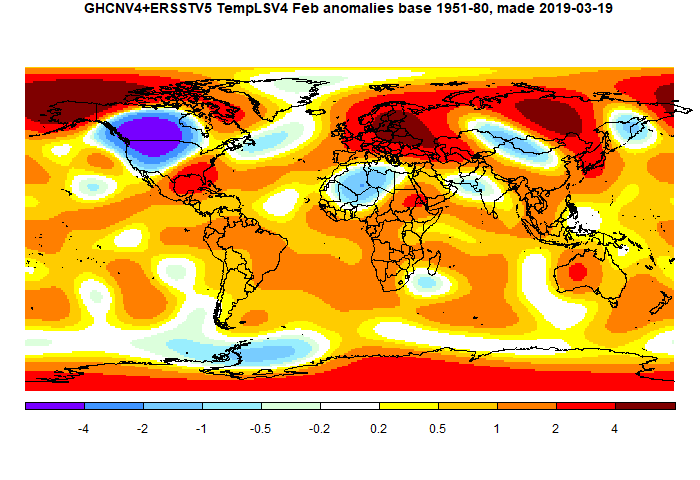
The overall pattern was similar to that in TempLS. Huge warm spots in Siberia and NW N America/Arctic. Cool spots in NE USA through Labrador to Greenland, and Arabia through N India. Warm in Australia and S Africa.
As usual here, I will compare the GISS and previous TempLS plots below the jump.
Here is GISS V3

And here is the TempLS V3 spherical harmonics plot

As said above, I'll also show the corresponding V4 plots (GISS is marked beta):
It is similar to V3, but with less grey. Here is the TempLS V4 version, again similar to V3
This post is part of a series that has now run for six years. The GISS data completes the month cycle, and is compared with the TempLS result and map. GISS lists its reports here, and I post the monthly averages here.
The TempLS mesh data is reported here, and the recent history of monthly readings is here. Unadjusted GHCN is normally used, but if you click the TempLS button there, it will show data with adjusted, and also with different integration methods. There is an interactive graph using 1981-2010 base period here which you can use to show different periods, or compare with other indices. There is a general guide to TempLS here.
The reporting cycle starts with a report of the daily reanalysis index on about the 4th of the month. The next post is this, the TempLS report, usually about the 8th. Then when the GISS result comes out, usually about the 15th, I discuss it and compare with TempLS. The TempLS graph uses a spherical harmonics to the TempLS mesh residuals; the residuals are displayed more directly using a triangular grid in a better resolved WebGL plot here.
A list of earlier monthly reports of each series in date order is here:


Nick, after some delay due to time constraints, the loss of the MEI and so, I've calculated some statistical GISS predictions for 2019. Where should I post this? Here or in the old Prospect for 2018?
ReplyDeleteUli,
DeleteYes, sorry there isn't a prospects post for this year. The US government shutdown messed up the timing. Yes, I think it would be good to post here. The main thing is to have a reference point that we can pint to at year end.
After some delay, there are the remaining predictions of my statistical model. The main problem is the loss of the MEI time series. I tried to compensate it by using more temperature data, but this slowed down the calculation very much.
ReplyDeleteI used the MEI values only to Nov18 in all case below. No MEI2 values are used up to now. Errors and bias may larger due to no MEI values after Nov18.
I update my prediction for GISS(v3) temperature anomaly using data up to Dec18.
DJF19 0.94+-0.14
MAM19 0.97+-0.17
JJA19 0.90+-0.14
SON19 1.02+-0.15
J-D19 0.97+-0.12
Using GISS Data until Jan19:
GISS.v3
DJF19 0.92+-0.07
MAM19 0.93+-0.16
JJA19 0.89+-0.14
SON19 1.00+-0.15
J-D19 0.94+-0.10
GISS.v4
DJF19 0.95+-0.08
MAM19 0.96+-0.16
JJA19 0.89+-0.13
SON19 1.02+-0.15
J-D19 0.97+-0.10
Using GISS Data until Feb19:
GISS.v3
MAM19 0.93+-0.16
JJA19 0.88+-0.14
SON19 1.00+-0.15
J-D19 0.93+-0.10
GISS.v4
MAM19 0.95+-0.16
JJA19 0.89+-0.13
SON19 1.02+-0.15
J-D19 0.95+-0.10
Using GISS Data until Mar19:
GISS.v3
MAM19 1.00+-0.08
JJA19 0.89+-0.13
SON19 1.01+-0.15
J-D19 0.97+-0.08
GISS.v4
MAM19 1.04+-0.07
JJA19 0.92+-0.12
SON19 1.03+-0.15
J-D19 1.00+-0.08
Thanks, Uli
Delete"remaining predictions of my statistical model."
ReplyDeleteWhy statistical?
As contrast to physics based models.
ReplyDeleteIt is in principle multi-linear regression. So it models the temperature data with a weighted sum of previous temperature data, MEI values, linear trends, and such - plus noise. The coefficients are determined from the 1950 to 2018 data.