Back in early 2013, I
posted some animations showing various hurricanes from 2012 and earlier superimposed on a high resolution (1/4 degree) map of sea surface temperature (such as you can see
here). I've just realised that Hurricane Florence shows this particularly well. The movie of the last 50 days is
here. Here are some stills:
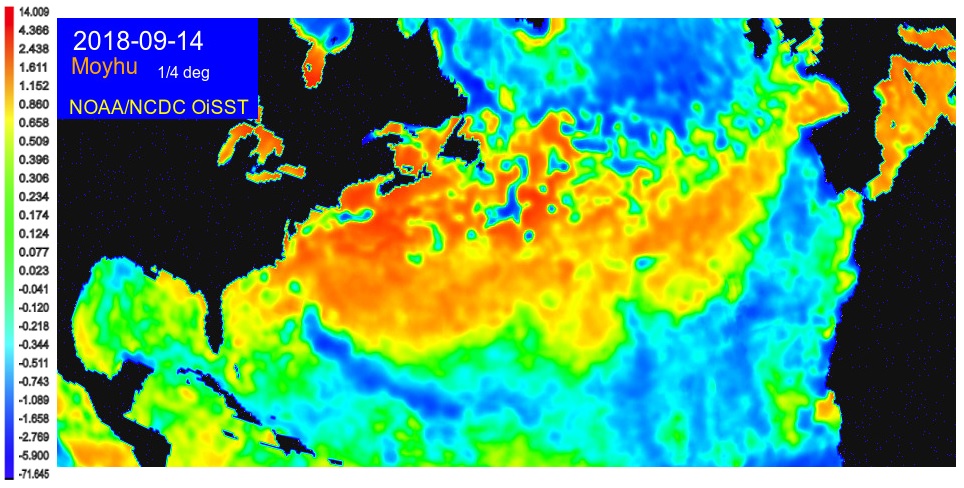
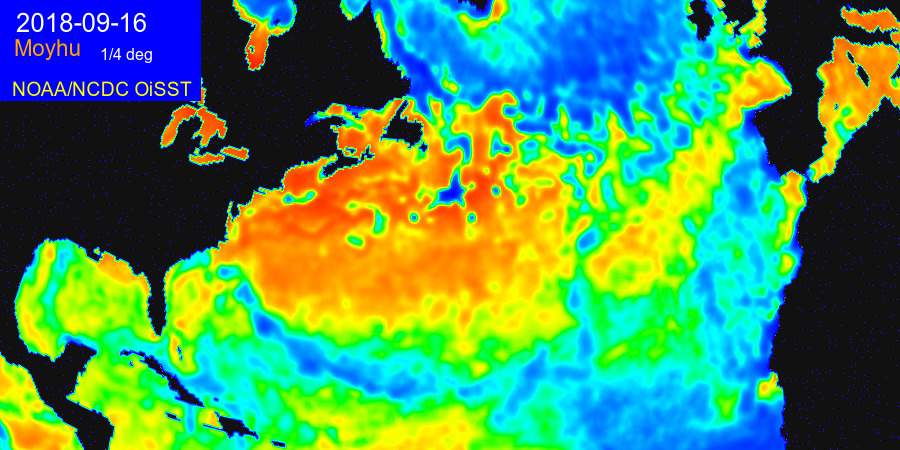


That effect seems to be not that well known. The hurricane is essentially sucking the energy out of the ocean and leaving a wake of colder water along its path.
ReplyDeleteNow if you think about the other 5 or 6 cyclones that were developing when F was traveling along the path, they were bound to diminish in strength when they hit the colder water. (I haven't heard much about them in the news since)
This research on cyclone formation also looks intriguing.
"Recently, researchers at the Naval Postgraduate School in California found that even smaller ocean disturbances with high Rossby numbers, like vortices within submarine wakes, are influenced by the Coriolis effect."
Even though it is only a modeling result, it is surprising that the Coriolis effect would impact vortices at the scale of 10 meters in diameter.
Perhaps there is something to the folklore that toilets flush in the opposite direction in Australia than they do in the northern hemisphere?