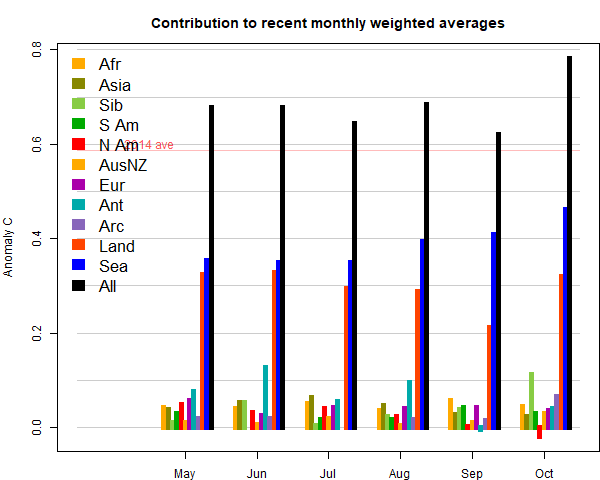
The marked feature was a big rise in SST, balanced by a cooling on land, especially in N Canada. There was a band of warmth from NW Russia through Europe into Africa. Antarctica was cold. Here (from here) is the plot of relative contributions to the rise (ie components weighted by area). Note, as mentioned above, the strong effect of the SST rise on the global average:
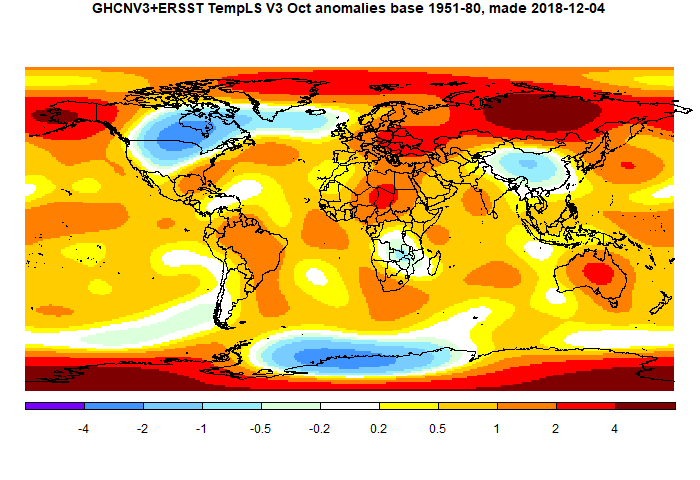
Here is the temperature map. As always, there is a more detailed active sphere map here.
This post is part of a series that has now run since 2011. The TempLS mesh data is reported here, and the recent history of monthly readings is here. Unadjusted GHCN is normally used, but if you click the TempLS button there, it will show data with adjusted, and also with different integration methods. There is an interactive graph using 1981-2010 base period here which you can use to show different periods, or compare with other indices. There is a general guide to TempLS here.
The reporting cycle starts with a report of the daily reanalysis index on about the 4th of the month. The next post is this, the TempLS report, usually about the 8th. Then when the GISS result comes out, usually about the 15th, I discuss it and compare with TempLS. The TempLS graph uses a spherical harmonics to the TempLS mesh residuals; the residuals are displayed more directly using a triangular grid in a better resolved WebGL plot here.
A list of earlier monthly reports of each series in date order is here:


Unchanged from August seems reasonable, similar to the reanalyses, but there are many countries that have not reported yet: From Mexico down to Bolivia, Greenland, Kazakstan, Sudan, Ethiopia, Indonesia..
ReplyDeleteHowever, next month I believe than the effects of the weak el Nino will kick in.
Nino 3.4 and Global SST are definitely on the rise:
https://www.tropicaltidbits.com/analysis/ocean/nino34.png
https://www.tropicaltidbits.com/analysis/ocean/global.png
I've been looking for a year with similar development of the ONI, and the best match I've found is 2006. That year was 0.61 C in Gistemp loti, and if we assume an underlying trend of 0.20 C/decade, 2018 will end up 0.24 C higher than 2006, which is 0.84 C.
(The difference between the strong el Nino years 1998 and 2016 is 0.36 C, equal to a trend of 0.20 C/decade)
Here's a link to ONI if anyone want to compare years:
Deletehttp://origin.cpc.ncep.noaa.gov/products/analysis_monitoring/ensostuff/ONI_v5.php
Thanks, Olof
DeleteONI=Oneanic Nino index. That is an interesting and useful table. Yes, it seems something Nino-ish is happening, with sea temperatures definitely on the rise.
Thanks Nick,
DeleteI should have spelled out, acronyms are not always well known..
Anyway, the Oceanic Nino index is the official NOAA/NCEP index deciding whether there is an el Nino, la Nina , or neutral. The exact definitions kan be read in the link above.
There is a little lag in the ONI since it is based on running 3 month means.
The figures are also provisional up to 15 years, until the data has a centered 30 year base period.
NOAA has of course not monopoly on declaring el NInos, etc. Other institutions, eg BOM, use other definitions.
PS Poor addition on my behalf in the comment above. 0.61 + 0.24 is of course 0.85
If you can declare one based on rainfall in North Texas, lol, it's already an El Niño.
DeleteKlaus Wolter's MEI index is also moving slowly up:
Deletehttps://www.esrl.noaa.gov/psd/enso/mei/table.html
https://www.esrl.noaa.gov/psd/enso/mei/index.html
Big news out of the climate indices department. The QBO is accelerating through a sign reversal according to the latest data. It was readily predicted from LTE
ReplyDeletehttp://contextearth.com/2018/10/16/asymptotic-qbo-period/