I see GISS has already posted (no change) - you have to be early to get ahead of them lately. But I'll produce the normal pair of posts with TempLS results and then comparison.
The TempLS analysis, based on GHCNV3 land temperatures and the ERSST sea temps, showed a monthly average of 0.52°C for November, down from 0.54 °C in October. I had reported 0.52 °C for October, but late data raised it a bit. These are small changes. There are more details at the latest temperature data page.
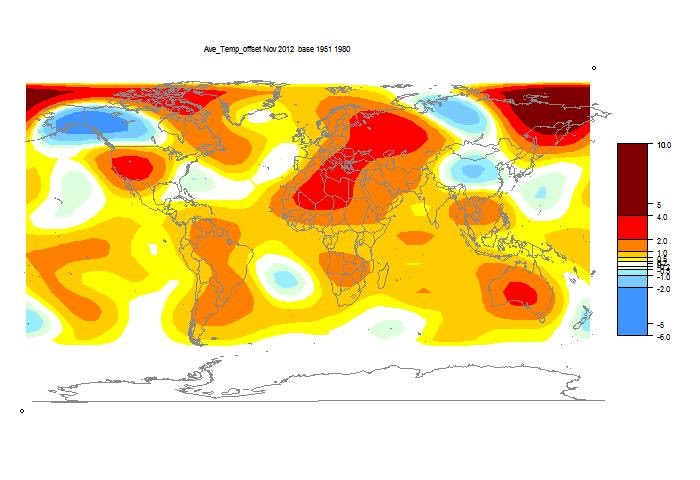
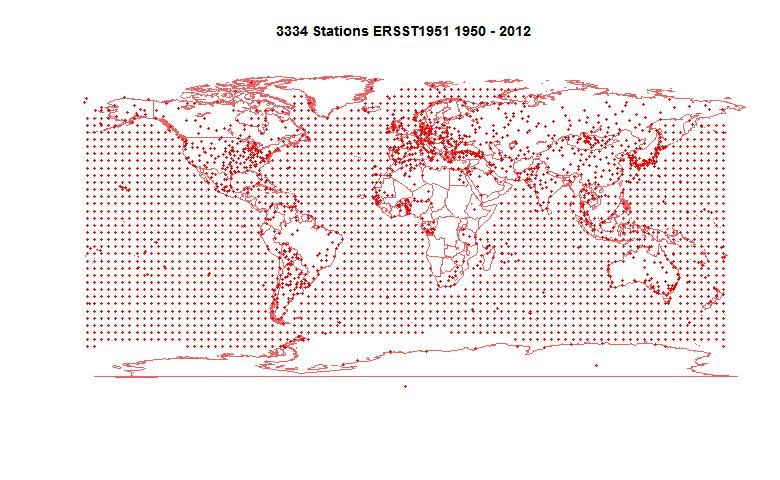
Below is the graph (lat/lon) of temperature distribution for November. I've also included a count and map of the stations that have reported to this date.

This spherical harmonics plot is done with the GISS colors and temperature intervals, and as usual I'll post a comparison when GISS comes out.
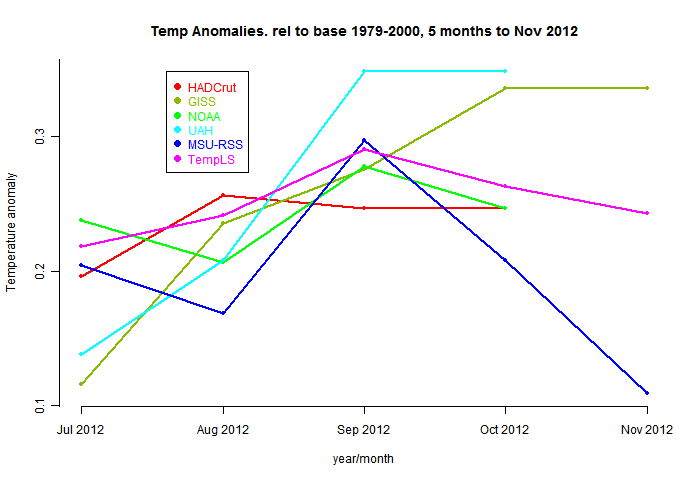
And here, from the data page, is the plot of the major indices for the last four months:

Here is the map of 3334 "stations" which contributed to this report. That's even lower than last month. So I probably couldn't have done this analysis any earlier.


0 comments:
Post a Comment