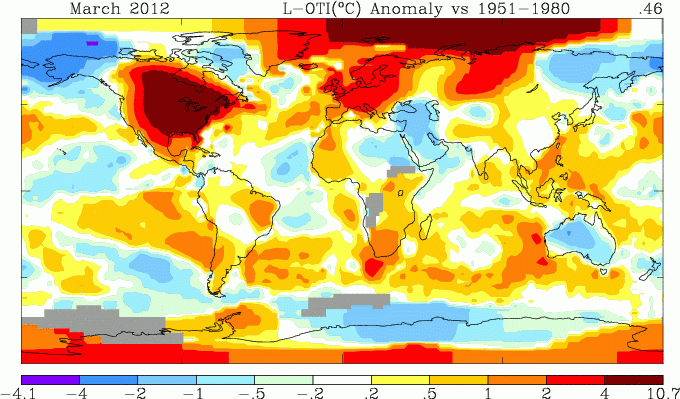
As usual, I compared the previously posted TempLS distribution to the GISS plot. Here is GISS:

And here is the previous TempLS spherical harmonics plot:

There is a disagreement over the Phillipines, where I get a cold spot and GISS doesn't. Otherwise they match well.
.
Previous Months
FebruaryJanuary
December
November
October
September
August
More data and plots


Typo alert - going by your earlier post 0.193 °C should read 0.29 °C.
ReplyDeleteThanks, Jon,
DeleteYes, 0.293. Fixed.
To beat on one of Eli's hobby horses, what the world REALLY needs is a figure of merit for determining how such anomaly maps match. Of course, this is one of those let's you and him fight comments.
ReplyDelete