Thursday, October 15, 2020

GISS September global up by 0.13°C from August.

The GISS V4 land/ocean temperature anomaly was 1.0°C in September 2020, up from 0.87°C in August. That compares with a 0.095deg;C rise (now 0.115°C) in the TempLS V4 mesh index. As with TempLS, it was the warmest September in the record.

As usual here, I will compare the GISS and earlier TempLS plots below the jump.

Monday, October 5, 2020

September global surface TempLS up 0.095°C from August.

The TempLS mesh anomaly (1961-90 base) was 0.837deg;C in September vs 0.742°C in August. This rise was less than the rise in the NCEP/NCAR reanalysis base index, which was 0.203°C. The UAH satellite data for the lower troposphere also rose more, by 0.14°C.

It was the warmest September in the TempLS record; next was 2016 at 0.781°C.

Again N Siberia and the adjacent Arctic Ocean was very warm. There was also warmth in the Near East, including E Mediterranean, and in Antarctica. There was a cool region in Central Asia; N America was split between a warm West and cool central and East. S America was warm.

Here is the temperature map, using the LOESS-based map of anomalies.


As always, the 3D globe map gives better detail.

Saturday, October 3, 2020

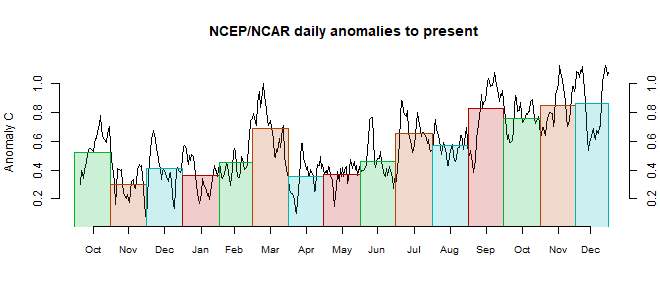
NCEP/NCAR reanalysis September 2020 global surface temperature up 0.203°C from August.


The Moyhu NCEP/NCAR index came in at 0.35°C in September, following 0.147°C in August, on a 1994-2013 anomaly base. The rise was enough to counter recent monthly falls, making it the warmest month since April. The temperature was fairly even during the month, with no major spikes.

The main warm regions were Siberia and the adjacent Arctic and most of Europe except the Atlantic seaboard. Greenland was cold, and much of N America except the Pacific coast. The main other cool region was the Eastern Pacific. The Antarctic was mixed.


Tuesday, September 15, 2020

GISS August global down by 0.05°C from July.

The GISS V4 land/ocean temperature anomaly was 0.85°C in August 2020, down from 0.90°C in July. That compares with a 0.049deg;C fall in the TempLS V4 mesh index. Jim Hansen's report is here, discussing how 2020 is becoming less lokely to catch 2016 as hottest year. 2020 had the fourth warmest August in the record, behind 2016, 2017 and 2019.

As usual here, I will compare the GISS and earlier TempLS plots below the jump.

Sunday, September 6, 2020

August global surface TempLS down 0.049°C from July.

The TempLS mesh anomaly (1961-90 base) was 0.725deg;C in August vs 0.774°C in July. This drop was less than the fall in the NCEP/NCAR reanalysis base index, which was 0.067°C. The UAH satellite data for the lower troposphere showed a smaller fall of 0.01°C.

There was a warm spot in N Central Siberia, and general warmth in the Americas, except for a region in the Mississippi area. Europe and N Africa were warm. Antarctica was mixed.

Here is the temperature map, using the LOESS-based map of anomalies.


As always, the 3D globe map gives better detail.

Saturday, September 5, 2020

NCEP/NCAR reanalysis August 2020 surface temperature down 0.067°C from July.

The Moyhu NCEP/NCAR index came in at 0.147°C in August, following 0.214°C in July, on a 1994-2013 anomaly base. July was well down on earlier months, so that continues a fairly cool period.

Central Siberia and the Arctic were warm, as was the Western USA. Antarctica was mixed, and there was a general band of cool across Asian mid-latitudes.


Saturday, August 15, 2020

GISS July global down by 0.03°C from June.

The GISS V4 land/ocean temperature anomaly was 0.89°C in July 2020, down from 0.92°C in June. That compares with a 0.039deg;C fall in the TempLS V4 mesh index. As with TempLS, Gistemp still had July tied with 2019 as the warmest July in the record. Jim Hansen's report is here.

As usual here, I will compare the GISS and earlier TempLS plots below the jump.