Wednesday, March 8, 2017

Moyhu WebGL interactive graphics facility, V2.

As mentioned in the previous post, I've been working on a new version of a WebGL graphics facility that I first posted three years ago. Then it was described as a simplified access to WebGL plotting of data on a sphere, using the active and trackball facilities. It could work from a fairly simple user-supplied data file. I followed up with an even simpler grid-based version, which included a text box where you could just paste in the lat/lon grid data values and it would show them on an active sphere.

So now there is an upgrade, which I'll call V2. Again, it consists of just three files; an HTML stub MoyGLV2.html, a functional JavaScript file called MoyGLV2.js, and a user file, with a user name. The names and locations of the JS files are declared in the html. Aside from that, users just amend the user file, which consists of a set of data statements in Javascript. JS syntax is very like C, but the syntax needed here is pretty universal. The user files must be set before the MoyGLV2.js or equivalent in the HTML.

The main new features are:
  • The merging of the old grid input via a new GRID type, which only requires entry of the actual data.
  • An extension of the user input system that came with the grid facility. A variety of items can now be put in via text box (which has a 16000 char limit).
  • A multi-data capability. Each property entered can now be an array. radio buttons appear so that the different instances can be selected. This is very useful for making comparisons.
  • A flat picture capability. The motivation was to show spheres in 3D, but the infrastructure is useful for a lat/lon projection as well.
  • A compact notation for palettes, with color ramps.

I'll set out the data requirements below the jump, and some information on the controls (which haven't changed much. Finally I'll give a grid example, with result, and also below that the code for palette demo from the last post. The zip-file which contains code and example data is here. There is only about 500 lines of JS, but I've included sample data.


February global surface temperature up 0.106°C.

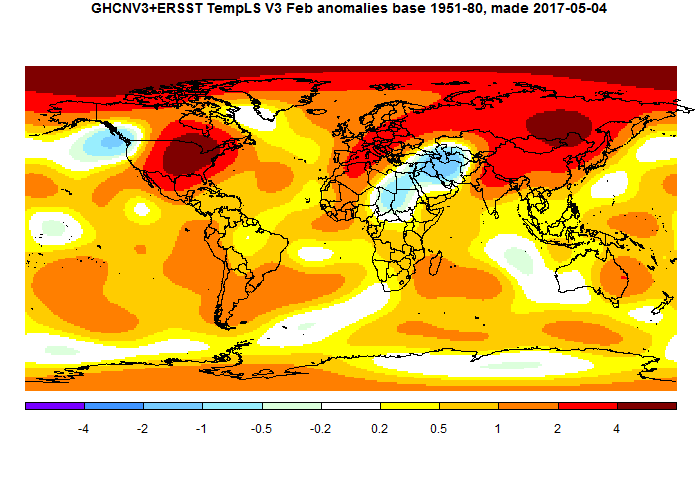
TempLS mesh posted another substantial rise in February, from 0.737°C to 0.843°C. This follows the earlier very similar rise of 0.09°C in the NCEP/NCAR index, and smaller rises in the satellite indices. Exceeding January, February was record warm by any pre-Nino16 standards.It was warmer (in anomaly) than any month before October 2015.

TempLS grid also rose by 0.11°C. The breakdown plot showed the main contributions from Siberia and N America, with Arctic also warm. The map shows those features, and also cold in the Middle East.


Sunday, March 5, 2017

Playing with palettes in WebGL earth plotting.

Three years ago, I described a simplified access to WebGL plotting of data on a sphere, using the active and trackball facilities. It could work from a fairly simple user-supplied data file. I don't know if anyone actually used it, but I certainly did. It is the basis for most of my WebGL work. I followed up with an even simpler grid-based version, which included a text box where you could just insert the lat/lon grid data values and it would show them on an active aphere.

I've been updating this mechanism, and I'll post a new version description in a few days, and also a more substantive application. But this post just displays a visual aspect that users may want to play with.

I almost always use rainbow palettes, and they are the default in the grid program. But they are deprecated in some quarters. I think they are the most efficient, but it is good to explore alternatives. One feature of the new system is that you can show and switch between multiple plots; another is that the textbox system for users to add data has been extended.

The plot below shows January 2016 anomalies, as I regularly plot here. On the top right, you'll see a set of radio buttons. Each will show the same plot in a different color scheme. The abbreviations expand in a title on the left when you click. They are just a few that I experimented with. The good news is, you can insert your own palettes. I'll explain below the plot.


As usual, the Earth is a trackball, and dragging right button vertically will zoom. Clicking brings up data for the nearest station. "Orient" rotates current view to map orientation.

In the new scheme, you can alter data by choosing the correct category in the dropdown menu top right, and then pasting the data into the text box, and then clicking "Apply". There is a shortened format for palettes. Colors are represented by an RGB triple between 0 and 1 (this is the GL custom). 0,0,0 is black, 1,0,0 is red. So you can enter a comma-separated set of numbers in groups of four. The first three are the RGB, and the fourth is the number of colors that ramp to the next one. The total length should be 256. The last set of four needs a final integer for format, but it can be anything. The series should be in square brackets, indicating a Javascript array. Here is a table of the data I used:

Array of dataDescription
[[1,0,0,64, 1,1,0,64, 0,1,0,64, 0,1,1,64, 0,0,1,64]Rainbow spectrum
[1,0,0,96, 1,1,0,80, 0,1,0,48, 0,1,1,32, 0,0,1,64]Rainbow tinged red
[1,0,0,32, 1,1,0,48, 0,1,0,80, 0,1,1,96, 0,0,1,64]Rainbow tinged blue
[1,0,0,64, 1,1,0,64, 1,1,1,64, 0,1,1,64, 0,0,1,64]Red, yellow white and blue
[1,0,0,128, 1,1,1,128, 0,0,1,1],Red white and blue
[0.62,0.32,0.17,128, 0.7,0.7,0.3,128, 0.4,.6,.2,1]Earth: brown to olive
[0.62,0.32,0.17,128, 0.7,0.7,0.3,104, 0.4,.6,.2,24, 0,0,1,1]Earthy with blue
[1,1,1,256, 0,0,0,1]White to Black


You can enter a similar sequence in the text box and see what it looks like. It will replace the currently selected palate. You can even change the button label by selecting "short", or the label top left by selecting "long", in each case entering your phrase with quotes in the text box.



Friday, March 3, 2017

NCEP/NCAR rises again by 0.09°C in February

It's getting very warm again. January was warmer than any month before October 2015 in the MOyhu NCEP/NCAR reanalysis index. February was warmer again, and is warmer than Oct/Nov 2015, and behind only Dec-April in the 2015/6 El Nino. And it shows no downturn at end month.

Karsten also had a rise of 0.1°C from GFS/CFSR. UAH V6 is up by 0.05°C. And as I noted in the previous post, Antarctic sea ice reached a record low level a few days ago.


Wednesday, March 1, 2017

Record low sea ice minimum in Antarctica

I've been tracking the Antarctic Sea Ice. It has been very low since about October, and a new record looked likely. Today I saw in our local paper that the minimum has been announced. And indeed, it was lowest by a considerable margin. The Moyhu radial plot showed it thus:


The NSIDC numbers do show that there is still melting, but if so, it won't last much longer. The Arctic seems to be at record low levels again also, which may be significant for this year's minimum.


Thursday, February 16, 2017

GISS rose 0.13°C in January; now 0.92°C.

Gistemp rose from 0.79°C in December to 0.92°C in January. That is quite similar to TempLS mesh, where the rise has come back to 0.094°C. There were also similar rises in NCEP/NCAR and the satellite indices.

As with the other indices, this is very warm. It is almost the highest anomaly for any month before Oct 2015 (Jan 07 at 0.96°C was higher). And according to NCEP/NCAR, February so far is even warmer.


I'll show the regular GISS plot and TempLS comparison below the fold

Wednesday, February 15, 2017

Changes to Moyhu latest monthly temperature table.

A brief note - I have changed the format of the latest monthly data table. The immediate thing to notice is that it starts with latest month at the top.

Before there were two tables - last six months of some commonly quoted datasets, and below a larger table of data back to start 2013, with more datasets included. This was becoming unwieldy.

Now there is just one table going back to 2013, but starting at the latest month, so you have to scroll down for earlier times. It has those most commonly quoted sets, but there are buttons at the top that you can click to get a similar table of other subsets. "Main" is the start table; "TempLS" has a collection (coming) of other styles of integration, and also results with adjusted GHCN.

I'm gradually moving RSS V4 TTT to replace the deprecated V3 TLT. I'm still rearranging the order of columns somewhat. There is reorganisation happening behind the scenes.