Showing posts sorted by date for query heat wave. Sort by relevance Show all posts

Tuesday, March 1, 2016

GWPF's "statistical forecast"

There was a flurry of articles in the usual Press places, about a statistical forecast of future temperatures sponsored by the GWPF (Murdoch, Express,Daily Mail). Blog reaction tended to focus on the total ignoring of physics, or, more frequently, the observation that:
"The GWPF paid Terence Mills, professor of applied statistics at Loughborough University, £3,000 to write the report."

Well, those are cogent criticisms. But time series analysis is a respectable enough endeavour, so I read the report to see if the GWPF got its money's worth.

The answer is no, or maybe from their poiunt of view, yes. There are about 33 quite well-written pages, borrowing I suspect from lecture notes (nothing wrong with that). But the forecasts themselves are worthless. Gavin Schmidt tweeted the following test of the HADCRUT forecasts, which were from 2014, after just one year:
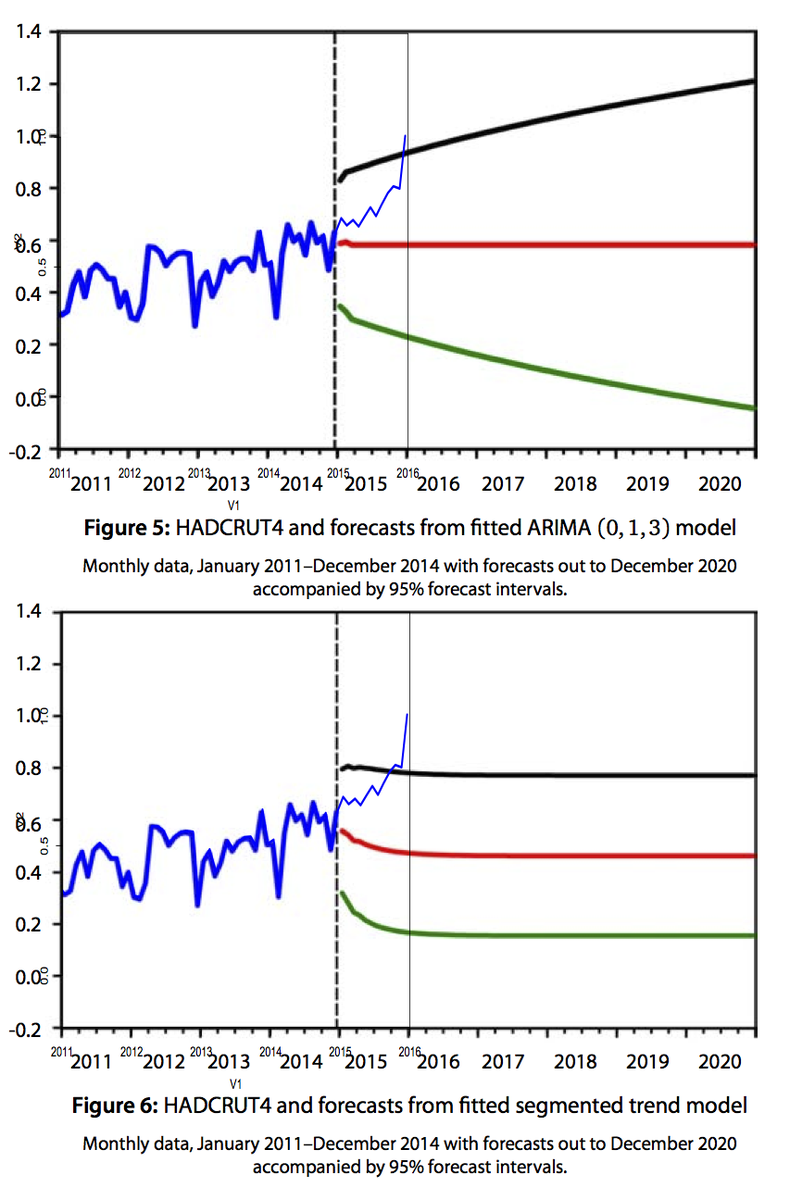
The thin blue line is 2015 information added by Gavin, and as you see, they are already outside the confidence intervals.

Now it might be said that briefly going beyond the CI's is note a complete refutation, though it very likely won't be brief. The real reason that the forecasts are worthless is that in every case they simply foretell that the expectation for the future is no change at all. The forecast is just constant after a few months, based on a very recent weighted average of data points. It has to be - that is built into the models. In fact, the author actually says this:
"The central aim of this report is to emphasise that, while statistical forecasting appears highly applicable to climate data, the choice of which stochastic model to fit to an observed time series largely determines the properties of forecasts of future observations and of measures of the associated forecast uncertainty, particularly as the forecast horizon increases."
It would be good if he had emphasised that more; it's true (my bold). But in fact what is emphasised is the forecast. And in the press, the slow growth of the forecast. But, as said, that is built in. His models are simply incapable of forecasting change. I'll show why.

Tuesday, November 3, 2015

NCEP/NCAR index up 0.2°C in October

I posted earlier about a big spike in the Moyhu NCEP/NCAR index in early October. That index is one that I derive by integrating NCEP/NCAR reanalysis data, as explained here. The index came back from the peak, but only back to levels that would have been seen as very high in earlier months, and stayed high right to end month. So the average finished at 0.567°C, as compared to September 0.368°C. These numbers are relative to base years 1994-2013.

That makes October by far the highest monthly anomaly in the record; in fact, it beats the previous record (Jan 2007) by 0.15°C. That can be seen in the following graph of all monthly anomalies since 1994:

Relative to the 1951-80 base of GISS, October would be 1.18°C, and on the NOAA 20th Cen base, it would be 1.14°C. I wouldn't expect to see those indices rise so high, because they have been somewhat lagging the NCEP/NCAR index recently. In September, GISS was only 0.81°C. Still, there is clearly a possibility of GISS reaching 1°C, and a very strong probability of being the highest anomaly ever, in all indices.

In a related news item, Australia's October was the hottest month ever. Also very dry, where I am. We had a very unusual heat wave at the start of the month, and it continued mostly warm and sunny. It looks like a dangerous fire season coming.


Thursday, January 23, 2014

Heat Wave in Victoria

Update - I've extended the table of temperature extremes below
Tennis fans everywhere will know that we had a pretty torrid heat wave last week, the first week of the Australian Open. It wasn't our hottest, but it went for four days. In Melbourne max temperatures were were 42.8,41.7, 43.9 and 43.9°C, or, if you prefer,109, 107, 111, 111°F. This forecast from the BoM explains what was happening; it happened as predicted, a bit warmer at the end. MikeH in comments noted this more complete report from B0M.

There's the usual argument about AGW. WUWT doesn't think so. In fact, they won't much concede that it was hot, and say it happens all the time here. So I thought I'd review in this post our summer temperature history, and also refute some notions that it's all happened before but been hushed up by "adjustments".


Monkey Mia, WA, From ABC

Data


The Bureau of Meteorology here has online daily data which is unadjusted. It's convenient to use, but not to download. For that I used GHCN Daily files which can be found here. They are unadjusted historic temperatures, derived from (and apparently identical to) BoM. Melbourne’s file is ASN00086071.dly; it has good coverage from June 1855 to Dec 2013. I supplemented it with current online data to date.. I extracted them to a CSV file which I've placed here.

Plots


I've plotted each summer (DJF) max temperatures from 1856 to 2014 (counting by the JF year).


1860
1870
1880
1890
1900
1910
1920
1930


1940
1950
1960
1970
1980
1990
2000
2010

You can switch from year to year using the top buttons, and go to any decade year with the radio buttons.

Our summers are made up of many pleasant days, with southerly winds, with heat when the wind blows from the North. Notably hot summers were in 1908, 1939, 1983, 2009. The last three had devastating wildfires on the hottest days, which I've linked. Big heat has bad consequences here. We lose towns, homes and people.

Table of extreme temperatures

Originally, I had here a list of the twenty hottest days in Melbourne since 1855. Following a suggestion in comments by SC M, I have updated to inclide tables of the 20 highest daily max, highest min, lowest max and lowest min. I've marked those occurring in the last five years in red. For highest max, there are seven. Click the buttons.

High Max  Low Max  High Min  Low Min


Adjustments?

In the WUWT thread I encountered over and over claims that BoM had rigged the records by adjusting old readings downwards. It's very hard to get specifics (typically the complainant just gives a link, which is often to a rant about GHCN, or GISS). Eventually it crystallised to complaints about Acorn. This is a recent homogenised set of data for 112 chosen stations, starting in 1910. The lead post in fact claimed that the BoM had discarded all data before 1910, which puzzled me.

But of course the data is not discarded. All the old unadjusted data is available from BoM, and also from GHCN. And it is what the BoM uses when talking about station extreme temperatures. If you go to the Melbourne climate page, for example, it will tell you that the hottest December day was 15 December 1876. That's not Acorn.

So how do we know these are really unadjusted? I've known since boyhood that Melb reached 114.1°F on Jan 13, 1939. That's what the record still says. But I checked others. The National Library has an old Melb (and others) newspapers here. I've checked a few of the reportewd high temps; the GHCN record linked here agrees with the contemporary reports. I think it's up to claimants of adjustment to give one example from this dataset.

Friday, December 31, 2010

On greenhouses and the Greenhouse Effect

From time to time, some people get excited about the fact that the greenhouse effect seems wrongly named. An extreme case is the paper of Gerlich and Tscheuschner, where they devote a whole section 2 (19 pages) to the question. It continues to arise; Judith Curry touched on it in a recent thread, where discussion turned to the old Wood's experiment

The standard response correctly says that none of this matters. The atmospheric  GHE is what it is, and is no less true if it turns out that the allusion to greenhouses is inaccurate. Wikipedia takes this approach, with a refreshing brevity and directness.

However, there is a little more to the story (which still says nothing about the truth of the GHE). Greenhouses do work mainly by blocking heat loss through convection. But IR flux blocking is not totally insignificant.


Wood's experiment

The description of this in the 1909 Philosophical Magazine is indeed brief. Some people give the impression that he built a greenhouse out of rock salt, but the geometry seems to be simpler and on a much smaller scale. Still, he concluded:
It seems to me very doubtful if the atmosphere is warmed to any great extent by absorbing the radiation from the ground, even under the most favourable conditions.


This final statement is little emphasised, but seems to be amply justified by the sketchiness of the note:
I do not pretend to have gone very deeply into the matter, and publish this note merely to draw attention to the fact that trapped radiation appears to play but a very small part in the actual cases with which we are familiar.


Indeed he didn't.

Modern Greenhouses

Ironically, the situation that forced Wood to use rock salt as an IR-permeable material is now reversed. In his day, greenhouses were always made of IR-blocking glass. Now they are often made of IR-permeable plastic. And, in support of Wood, they do work. They block convective heat transport, and also provide an insulating effect to limit conduction through the boundary.

However, a moderate amount of heat is still transferred by IR. Ironically, a reason why it isn't larger on balance is because of the countervailing downwelling IR, also a subject of occasional skepticism. Downwelling IR, from the atmosphere and especially clouds, is not that much less than upwelling. Glass blocks both upwelling and downwelling; the nett flux blocking is small, but if you are focussing on the fate of heat emanating from the surface, the IR fraction that is blocked us a larger fraction.

A real greenhouse issue

A covering that blocks IR actually makes a real improvement to greenhouse efficiency. It is more expensive, and people are willing to pay for it. Here are some industry observations:
NSW Ag Dept:
For example, films may be used to exclude ultra violet (UV) light for chemical free pest control or reflect long wave infra red (IR) radiation to improve heat retention at night. ... Long wave radiation (2500-40000 nm) absorbers reduce the loss of heat radiated from materials and objects (including plants) inside the greenhouse.


Or this advice
You can also buy a plastic film with an infrared inhibitor; it cuts heat loss inside the greenhouse by up to 20% on a cloudless night.

Actually, it would also cut loss on a clear day.

And here is a pamphlet which describes the practicality in some detail (for heated greenhouses, but the principle is the same).
The IR / anti-condensation treated films cost about $0.015 per square foot more than untreated films but reduce energy use by 15 to 20%.

Scale Issues

The main thing wrong with the Wood's style reasoning is scale. IR blocking is a minor effect on the scale of a greenhouse because convection is relatively much more effective. The temperature gradients are huge compared to what is maintained in the atmosphere. Wood compounded this by experimenting on a much smaller scale again.

In the atmosphere, IR transport is more important than convection, so the blocking effect of GHG's matters much more.

.