The spherical harmonics map is here:

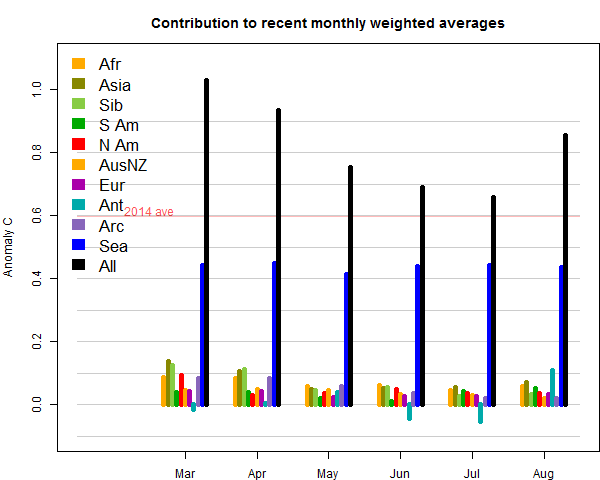
The regional temperature variations are similar to those in the NCEP/NCAR report, though the warmth in Russia is more pronounced. In the breakdown plot, you can see the big contribution from the change in Antarctica. SST also rose significantly.
On this basis, I would expect a rise of at least 0.1°C in GISS, with maybe smaller rises in NOAA and HADCRUT (less affected by Antarctica). In other news JAXA sea ice extent had a late melt rush and dropped below 2007 to be second only to 2012. It won't catch 2012, and the main marker remaining is whether it will drop below 4 million sq km. It is 4.023 now. NSIDC is also second place.


A mollweide projection would remove the emphasis from the huge red blob in the antarctic and put it in a more relative perspective.
ReplyDeleteHans,
DeleteYes, I use a lat/lon plot to match the GISS format; when that comes out I show them together. GISS does now offer a Robinson projection. My preference is a direct spherical projection on a trackball. You can see the August data in that format in much greater detail here. I use the same format for NCEP/NCAR.
Nick, this is a surprise rise. Up to now a thought GISS Aug16 could be 0.84 to 0.87 based on http://www.karstenhaustein.com/climate.php
ReplyDeleteIf GISS behaves similar to TempLS mesh it could be 1.00.
The GISS algorithm has the tendency to produce very similar anomalies over the Antarctic continent and the adjacent ice covered ocean regions. However, in GFS both regions often show spatially very heterogeneous anomalies due to orography over land. Whether the temperatures over ice covered ocean are correctly analysed in GFS is something I don't know, but I'm sure it represents reality much better than a fairly simple smoothing algorithm as applied in GISS. Either way, July was cold over the (Antarctic) continent and warm over much of the ocean. Hence GISS colder than GFS as GISS is controlled by the continental anomaly. August the opposite pattern, except that the land/ocean contrast is much stronger: karstenhaustein.com/climate
DeleteSo it's likely that GISS will be a bit warmer in August, perhaps similar to what TempLS mesh suggests. But even if Antarctica is much warmer, sometimes it's counterbalanced by differences in other regions. TempLS mesh was a good indicator in the past tho, so I'd say GISS is gonna end up somewhere between +0.9 and +1.0K.
KarSteN, I agree. GISS is up to 0.98.
DeleteAugust AMO rising toward its 1998 level... it's a stadium wave for heat.
ReplyDeleteVery interesting that the mesh vs grid approaches can show such big differences. To me this underscores some of the uncertainties involved in modeling a global temperature anomaly. I see from your breakdown plot that the Antarctic was by far the largest contributor to the big TempLS Mesh rise from July to August. The CFSV2 Antarctic temperature anomalies from UM CCI went from June -1.69C to July +0.37C to preliminary August +1.35C referenced to 1981-2010, showing a rise of +1.72C from July to August, similar to the rise in the TempLS Mesh. The second largest but much smaller contributor to the TempLS Mesh July-August rise looks like the "Sea" component if I am eyeballing it correctly. In contrast, the global UM CCI (grid?) estimate only increased by +0.03C from July +0.38C to preliminary August +0.41C referenced to 1981-2010, which is more in line with the rise in the TempLS Grid estimates.
ReplyDelete"Very interesting that the mesh vs grid approaches can show such big differences"
DeleteIt's unusually large this month. My grid method is primitive; I've talked here about its weaknesses and better methods. But I keep it for continuity (it's where I started) and because it is somewhat similar to HADCRUT and NOAA, and seems to track NOAA vry well. But it just ignores cells that have no data, which implicitly assigns to them the global average anomaly. That includes most of Antarctica, and so it misses changes there (as do other indices, to varying extent).
So I think grid is definitely low, but wouldn't be surprised to find mesh is high. All methods have trouble with sparse data.
With the contributions plot, remember that they are weighted by area. So the contribution from SST was second, but that might be small in °C. The idea of the plot is that the components do actually add to the change.
From the ASIF, European Copernicus have August being a full +0,17C warmer than previous record holder 2015.
ReplyDeleteAlmot the same as TempLS mesh - 0.16 higher than 2015.
DeleteThe UM CCI preliminary August 2016 global temperature estimate is +0.09C higher than August 2015 and only +0.02C higher than the previous record high for August 2003. The differences in these estimates are easily within the uncertainty range, so all we can say is that all of these years were high but there is a slight chance that August 2015 was the highest.
DeleteAs mentioned by Karsten previously, CFS and CFS2 joined together have a cooling bias in 2010/11. Per the report linked below, ERA-interim, MERRA, HADCRUT and NOAA all are in good overall agreement since 1979. Why muddle the picture by using an inferior dataset?
Deletehttps://climate.copernicus.eu/sites/default/files/ERA Report no. 25.pdf
Chubbs
There are issues with Era-interim as well. From p 4 in your link
Delete"A further adjustment of the standard ERA-Interim output is made. The two-metre temperatures over ice- free sea, and the SSTs when used alternatively, are reduced by 0.1°C for all months prior to January 2002."
This adjustment has not been done in the publicly available dataset, for instance that in KNMI Climate explorer, but the version in the monthly Copernicus climate report has been fixed.
Era-interim is also poor with Antarctica, with a pronounced cooling bias. For example, the trend for the South pole (1979-2015) is -0.39 C/dec, whereas that of Amundsen-Scott base met station is +0.18 C/dec for the same period.
Thats why the report is useful. Presumably the SST adjustment improves the ERA comparison to the other datasets. Would like to see a similar analysis for all the re-analysis series.
DeleteChubbs
BEST l/o has reported, August is up 0.22 C from July, very similar to TempLSmesh..
ReplyDeleteOne of the great unsung climatologists was Glenn Brier, who was both a fellow of the AMS and the American Statistical Association. Recently I found a virtually uncited research paper he co-wrote that was able to reveal a deterministic basis of ENSO covering the years 1525 to 1988. Two strong periods of 6.7 and 14 years underlie over 350 years worth of historical data.
ReplyDeleteK. Hanson, G. W. Brier, and G. A. Maul, “Evidence of significant nonrandom behavior in the recurrence of strong El Niño between 1525 and 1988,” Geophysical Research Letters, vol. 16, no. 10, pp. 1181–1184, 1989.
What is neat about this is that my own signal processing on the instrumental ENSO record was able to uncover the same fundamental periods (6.5 years and 14 years), which I think relate to orthogonal periodical wobbles in the Earth's rotation.
More info on the obscure Brier paper is here:
http://contextearth.com/2016/09/09/obscure-paper-on-enso-determinism/
AGW denier nutcases such as Anastosias Tsonis continue to report that behaviors such as ENSO are chaotic, which is so far off base.
Brier also gave us the Brier Score. It's still used today to judge the accuracy of weather forecasts.
DeleteThe Brier Score is a clever metric. I am using something close to that metric which is useful for measures that go +/- equally. What I do is count excursions that match in the same direction, and then calibrate it so that 0.5 is random agreement and 1.0 is perfectly matched excursions.
DeleteTalking about statistics, is there anyone that is as willfully misguided about the topic as Wonderin Willis?
Deletehttp://wattsupwiththat.com/2016/09/12/chinese-sunspots/
NASA GISS is in. August 2016 was a whole +0,98C warmer than the 1951-1980 average. The margin to August 2014 was 0,16C. In addition, the summer 2016 was the warmest on record at 0,88C above the average which was a solid 0,12C higher than last summer.
ReplyDeleteThanks Anon, and I've now written my usual post about the result.
Delete