There I tracked what happens to the climatology and anomalies, which I think is revealing. Here I won't mention that breakdown, but just show graphically how infilling works for averaging the absolutes, and how just dropping doesn't.
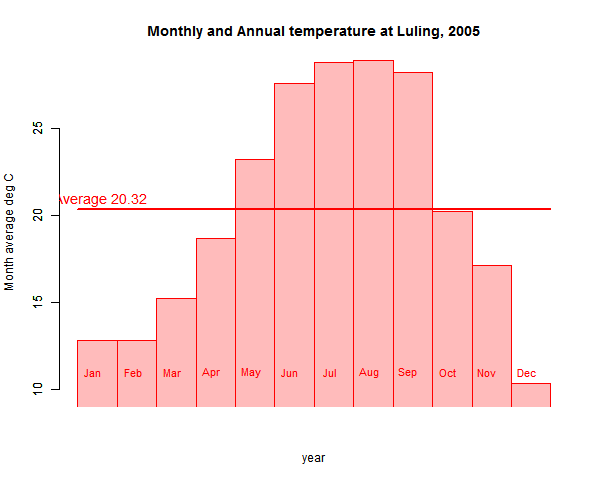
First I just plot the monthly averages. The red line is the annual average. It's just the red area (down to zero, not shown), or the simple average of the months.
This time I'll drop June (the pplot works better with a central value). The old red plot is shown with the green overlay after dropping. The other months are stretched to cover the gap; it's the same as reweighting June to zero. The stretching reflects the fact that in averaging, each month is (hopefully) divided by 11. It's as if there were 11 months in the year.
Actually I reweighted June to not quite zero, so you see a slightly thicker vertical between May and July.

The red average is 20.32°C, as before; after dropping June it is 19.66. You can see why; the other months in effect stretch to fill the space, and there are more winter months to expand. So the area under the green is less.
Now we'll see what happens if we infill - we don't remove June, but replace it with the average of May and July:

Now everything is back in place, and only June has a slight area discrepancy. The averages are much closer: 20.32 and 20.18. The difference is 0.14 instead of 0.66.
Finally, if you don't like "fabricating" the June reading, just leave it out, but instead of stretching all months, stretch just May and July. That is the reweighting option. It looks like this:

In fact the result is exactly the same as infilling. That is, pictorially, my contention that infilling in an average is just reweighting. In fact, when you just leave out, you upweight the other months equally; here you reweight the nearby ones. They are upweighted preferentially because their values are more likely to resemble June's.
So once again, there are various ways you can handle missing data in an average, but where climatology varies the very worst is to just leave it out. That applies to stations on a surface as well as months in a year.


Nick,
ReplyDeleteLet's be absolutely clear about one salient fact.
AFAIK and IMHO Goddard absolutely does not want the raw temperature data touched in any way.
Period.
Call this Goddard's Law for all I care (this may well be a straw man, but IMHO I don't expect Goddard to ever, plainly and truthfully, admit that any aspect of homogenization is valid).
Anyways, what this means in the real world is that no one could ever even consider the possibility of developing a climatology using historic land/sea surface temperature records anywhere on planet Earth.
See my previous post where all 1218 USHCN time series shift at least one month by at least 1.2 degrees F.
That basic point there, with that post, is that all 1218 USHCN final (homogenized) can be shown to be "fabricated" "moved" "shifted" "cooling the past" "warming the present" "infilled" "estimated" (the last two quoted words are to be associated by lying deniers with the words "make believe" or some such) (and/or any other salty language that those lying deniers wish to use).
In essence, you are arguing with and against a brick wall.
And, I really do appreciate all your efforts to argue with said brick wall, but hopefully you see the absolute black and white position that the lying deniers like Goddard have taken.
Hopefully.
And if you accept ANY questioning of USHCN final time series, that's where Willard Anthony Watts, et. al. come in with the informal logical fallacy of guilt by association, because of the "USA is always #1" mindset, just imagine what the rest of the world's land/sea surface temperature records must be like, or some such.
This is the same logical fallacy that Willard used in his two part post comparing the likes of Marcott, Mann, et. al. with the likes of Goddard.
I have dropped the "informal" from the above statement because IMHO and AFAIK the Venn diagram of those two groups do not intersect at all.
Never have, never will.
Now, when Willard talks about "confirmation bias" like he usually does, against the perceived "team", what he is obviously missing is that this is a double edged sword, it cuts both ways.
This gets us to the Willard, et. al. still to be submitted paper purporting microsite issues based on a guidance classification that has no objective statistical basis (no actual temperature/site data to support those "seat-of-the-pants" temperature bias ranges).
IMHO and AFAIK, only when their own self-selection set of stations is examined (the list of station ID's is absolutely critical to their central argument, and we won't ever see that list until that paper is actually published somewhere with their SOM (and all I care about is the station ID list, I don't give a hoot about boots on the ground images and/or satellite imagery)) will we see what forms of "confirmation bias" are contained therein.
Willard now agrees with Goddard (big surprise there, NOT!), by using the argument of "see my unpublished paper" where we show ~80% of USHCN (or whatever network that they are using) have microsite issues.
And don't get me wrong, I really do want them to publish that paper, somewhere/anywhere, as long as the list of stations they self-selected is included, and I don't even care if it's an open access (pay to play) journal or the most obscure off topic journal or even if it has absolutely no peer review or even if it's published in a trash anti-AGW journal like E&E.
They do seem to have a really tight echo chamber aspect about that paper, almost surly at this point in time, so my fondest hope is that it is given the "standard" peer review (paper read, sounds good, publish it, don't examine the data at all, and don't question the selection/criteria process at all).
"They do seem to have a really tight echo chamber aspect about that paper..."
ReplyDeleteI'm not on tenterhooks, though I'll be interested to see what Evan Jones comes up with. I was amazed though that after all their studies over the years, that Anthony is currently shocked to find that a fairly large fraction are not reporting at all.
Nick,
ReplyDeleteWillard is mad a heck with you, because, well because.
http://wattsupwiththat.com/2014/07/01/ncdc-responds-to-identified-issues-in-the-ushcn/#comment-1674412
In that little rand/screed/manifesto Willard states;
"Along with “estimated” data for a bunch of closed/zombie weather stations that shouldn't be reporting at all, and have no data in the raw data file."
Here's a little back story for you.
I have three degrees in civil engineering, the 1st one was a two year at Vermont Technical College in May 1975 (then UVM then Cornell).
That summer of 1975, I was lucky enough to work for the USACE CRREL in Hanover, NH as a GS-3.
My job, along with several others, was to update the CONUS snow load contour map, using all available historic raw monthly snow accumulation data.
This was all from stacks and stacks of computer printouts.
When a station was missing data, we INFILLED it using a simple three point average from the closest three adjacent stations (that formed a triangular enclosure for the missing data).
Perhaps not the best method, but that was almost 40 years ago.
I can't remember if we did any massive multiyear infilling though (Is that a requirement for the v2.5 USHCN to work?).
But at some point, contour maps are constructed from the final homogenized climatology either as anomalies and/or absolutes. Correct?
We never used those estimates to calculate any other missing data, all interpolation was from original raw data only.
Long story short? Infilling station data has been around a very long time, at least 40 years.
I really don't think that Willard has much, if any, technical background with regards to any form of data analyses.
But Goddard is definitely not even wrong.
Oh, and this update from Politifact (After the Fact);
http://www.politifact.com/punditfact/statements/2014/jun/25/steve-doocy/foxs-doocy-nasa-fudged-data-make-case-global-warmi/
Zeke has the last word and even a graph.
"Willard is mad a heck with you, because, well because."
DeleteYup. Some time during the thread "The scientific method is at work (!!) on the USHCN temperature data set" my responses started going in to moderation, so I could no longer engage in dialogue. And so it remains.
"Infilling station data has been around a very long time, at least 40 years."
The silly thing is, a method used my Menne, which may be the general USHCN method, integrates by interpolating everything on to a grid. It's all "fabricated". This is, of course, a standard technique.
i hope you can bear with me here nick . i have visited several blogs in relation to this topic in the hope of gaining an understanding from a laypersons point of view.
ReplyDeletethe explanation of the infilling adjustments above is excellent in clarity, however it highlights the issue i have in respect that the result does differ from the result if the actual data had been used .surely in any field where we are talking tenths of degrees that difference is significant ?
the actual issue as i understand it is currently infilling occurs for many areas as a result of homogenized data from urban stations being used where there has been drop out of rural stations ? i appreciate my questions may be technically naive ,but again,from a lay point of view,these are the issues i perceive .
Anon,
DeleteInfilling comes after homogenisation. It isn't trying to correct for anything; it's just a device for averaging. It deals with dropout from whatever cause.
Let me give an example from another field - polling. Despite some opinions, it mostly works. When pollsters have too few men, say, they regards that as a missing value problem. It is not a representative sample.
There are two ways you can correct. You can upweight - count the male views with a higher factor. Or you can add artificial men, who share the views, probably averaged, of the men in the sample.
The latter has the advantage that once you have created the artificial man, the rest of the arithmetic carries through unchanged. If you reweight, you have to track the weights. But basically, both have the same effect. And it's all to get a more unbiased answer.
It doesn't create new information. If you have 500 women, 400 men, then you have a sample of only 900. In fact, weighting increases the variance. But it can remove bias, which usually matters more.
Up next, ontological questions on how do we know anything, aren't the numbers you see on a thermometer just a figment of your imagination? You might be so brainwashed that you do not even notice how you repeat the fraudulent methods of scientists. The nihilistic argument against science, if you will. The USHCN measures 'temperatures' only at 3 hour intervals (if the 'record' is complete), so what happens between those moments? My cool shivers occasionally come more often so how can we be sure of the homogenisation and infilling methods? Additionally, I have a clear idea of why those are wrong, but somehow, when I try to write about it, the message gets scrambled between my brain and the keyboard? Am I brainwashed to a higher degree?
DeleteOale, You may jest, but Ross McKittrick (remember him?) managed to get a paper published in which he claimed there was no such thing as an average global temperature. In support of this he cited the various estimates made by different researchers: Hadcrut, GISS,, etc. - the excellent TempLS of our host hadn't yet come on the scene. The fact that these were all estimates using numerical integration of the same quantity - the surface integral of T over the Earth's surface - was completely lost on the poor man.
DeleteBill,
DeleteYes, that was a particularly stupid paper. It's actually a strawman. A global absolute temperature is something one should not try to measure. I argue this often, eg about USHCN. It's concisely expressed in this GISS FAQ (near the end).
What McKitrick's paper never deals with is that what is published is the average anomaly, which is something different, and perfectly calculable.
The irony is that Ross's paper was published in the thermo journal, where they don't know much about climate science, but are very familiar with quantities where the absolute amount is rarely if ever measured, but changes are very important. All the big ones like entropy, enthalpy, internal energy.
Thanks for the link to GISS explanation of why SATs aren't used in the analysis. Plenty of good reasons for that. Anyway local absolute temperatures are needed if one's to do any modelling on weather, given that evaporation and evapotranspiration depend on the absolute T, not the anomaly. On McKittrick, I'm likely too young to know that paper, or have missed it for other interests, but it smells like crap.
Deletein the example given,read and understood. in the case of the homogenisation in this instance,if the data homogenised is from urban stations and or stations from lower altitudes , does the process not generate a warming bias. would it be possible to document in simple terms how the actual homogenisation process takes place where the drop out of a rural or higher altitude station takes place to create the artificial station ?
ReplyDeleteFILNET (infilling for dropouts) comes after homogenisation, so doesn't affect it.
Deletethanks for taking the time to reply nick. so how is the infilling calculated to represent station drop out where the stations that dropped out were rural/higher latitude in a region where only/mostly urban stations remain to report ?
ReplyDeleteusing monthly averages from a region or individual station does not address this issue.
Infilling isn't meant in itself to be selective about different kinds of site. It's a very general process, used in many continuum calculations. When you calc a spatial average, each little area is taken to be approximated by values at stations in the region. If a station is dropped and infilled, that means that for areas that were using it to approximate, they now rely more on stations whose values contributed to that infill.
DeleteIf you want to rely more on rural stations, you can upweight them. That upweighting will follow through via infilling.
Of course there are tradeoffs. If rural stations have become scarce, you'll be preferring distant rural to closer urban. If you're low on the data you want, problems are inevitable. Infilling doesn't make them better or worse.
Re Watts being "mad" with Nick my guess is that he is probably otherwise preoccupied with trying to reconcile his warring contrarian colleagues, Monckton, Eschenbach, Svalgaard and Jo Nova and partner (Dr. " 11 year notch" Evans). It's fairly serious stuff with Monckton threatening Svalgaard and Eschenbach with litigation for libel against Evans. I wonder how M and E will get on at next week's contrarian junket in (appropriately enough) Las Vegas. Fordprefect at the climateandstuff blog managed to copy a chunk of a broadside against Monckton that appeared briefly on WUWT before being censored.
ReplyDeleteRambunctious stuff.
Yes, the response on that thread was definitely odd. Here is Brandon Shollenberger describing his experience. I'm still on moderation. I'm used to drifting in and out of that state; I think the mods get sick of it after a while, since there's nothing there's any reason not to pass ( and it does get through eventually). But I think you're probably right that there is too much else for them to worry about.
Delete