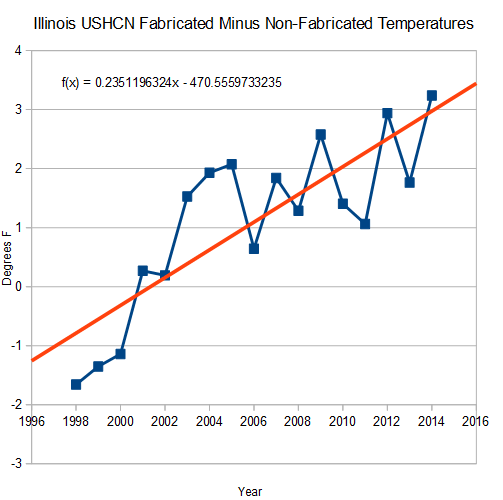
Zeke has been discussing USHCN adjustments and anomalies at Lucia's blog, specifically referring to Steve Goddard's continuing series of posts. SG has continued to get it wrong. Anyway, he bobbed up to point to this post, with the rather extraordinary claim that in Illinois, the adjustments make a difference of 23 °C/century (but only over the last 15 years). Zeke gave his own calc, which is quite different.
The claim is especially dubious because Illinois has a good record with fewer missing than USHCN generally, and his period is the last 15 years, relatively unaffected by adjustment.
So I did my own calc, using the code for the USCHN posts of here and here, but restricted to Illinois, where the 36 station numbers are from 110000 to 120000. I'll show plots below the jump. But this time I have no idea how he is getting it wrong, and he gives no code or detail. Illinois is much like USCHN, and there is little adjustment recently.
Here is SG's plot:

Here is my plot of the corresponding years.

F1-R1 is the correct way of calculating, averaging final-raw where both are known. SG-R1 is SG's method, where the average of all final, including interpolates, are differenced with the average of raw (a different set of stations). The red curve is the difference between green and blue. There is no big trend, as SG has, and the spread is much less.
Here is my plot of final-raw for the whole period. It corresponds to the whole USCHN story here

There is a spike in 2014, as explained earlier, caused by incomplete annual cycle, and some trouble before 1900. Otherwise very similar.
This time I have no idea where he has gone wrong.


My numbers were homogenized (infilled) - homogenized (non-infilled), which likely accounts for much of the difference. I was unclear if Goddard was conflating homogenization and infilling or not, and wanted to focus on the latter.
ReplyDeleteYes, I stuck mainly with trying to get the actual effect of adjustment. It isn't clear what Goggard is calculating, but I think you are probably right. In my notation it would be F2-F1, where F2 is average infilled. I've plotted q*(F2-F1), where q is the proportion infilled. Without the q it is noisy, because S2 (F2) often has very few members.
DeleteWhere, or how does UHI play into the temperatures?
ReplyDeleteUHI in V2 USHCN is discussed here. In V1 they made an explicit adjustment for UHI, which turned out to be rather small. V2 relies on changepoint detection.
Delete