February 2012 temperatures down 0.05°C
The TempLS analysis, based on GHCNV3 land temperatures and the ERSST sea temps, showed a monthly average of 0.18°C, down from 0.23 °C in January. As last month, this is in line with satellite LT trends. There are more details at the latest temperature data page.Below is the graph (lat/lon) of temperature distribution for February.

This is done with the GISS colors and temperature intervals, and as usual I'll post a comparison when GISS comes out.
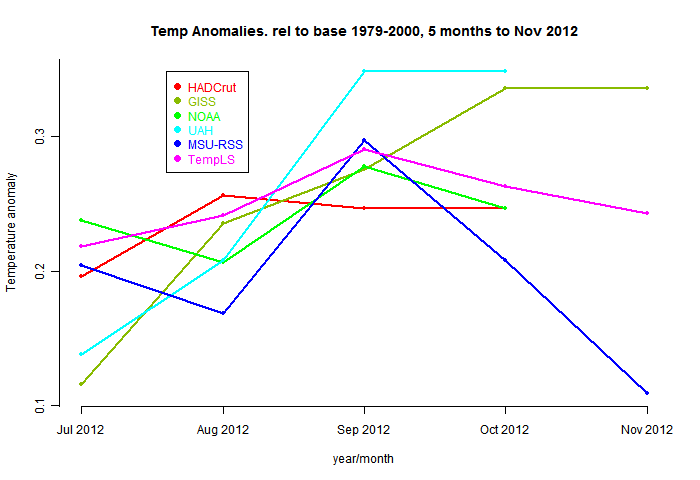
And here, from the data page, is the plot of the major indices for the last four months:


I have a thought...
ReplyDeleteDo you calculate the global temperature from the spherical harmonics, or from the weighted average of the station anomalies?
If the latter, how much of the N pole contributes to station weights (i.e. what is your coverage like)?
I'm wondering if the difference is due to the negative AO allowing cold air to leak out of the arctic, and warm air to leak in. This would push down any temperature index with a hole over the N pole.
If you do have a hole over the N pole, it would be interesting to see if the average of the spherical harmonic map behaves differently. (I'm guessing you have this as an intermediate result.)
Kevin C
Kevin,
ReplyDeleteI use a direct weighted average. But it's the same weighting as for the spherical harmonics fitting, so it should be just the zero order coefficient. I did check one and it was, at least that time.
The Arctic is weighted as elsewhere, and there is a danger of having empty elements. I looked into coverage issues here, and the preceding post. The Arctic coverage is shown in this projection. It's for CRUTEM3, but they are similar, as the comparison shows. Still, the empty cell problem is worse for Africa and Antarctica.
I've been developing fancy triangulation schemes to get around this, but I haven't yet been using them for the monthly calcs.
Kevin, I should mention that that pic was for April 2009, which was the time when many N Canada stations weren't reporting (properly). I don't think it's as bad as that normally.
ReplyDeleteTip for you Nick: crutem4 is now available for download:
ReplyDeletehttp://www.metoffice.gov.uk/hadobs/crutem4/data/download.html
Thanks, ebak
ReplyDeleteI'd been following that. CRU currently says that they have a NH average and a SH average, but not a global (though I can't see why not). And they are not currently promising monthly updates.
I've downloaded the Met version you linked - I'll check it out. I did analyses of CRUTEM3 station data - maybe time to see if CRUTEM4 is significantly different.
Difference of crutemp4 and crutemp3 (calculated as (NH+SH)/2) shows that the largest changes are in the 19th and 21st centuries.
ReplyDeletehttps://sites.google.com/site/arctischepinguin/home/cru4/crutemp4-crutemp3.png
Makes sense. The biggest changes should be in the eras where the most new information arrives. That includes the last decade and very early historical records, as more data becomes available and put online.
ReplyDeleteHey Nick,
ReplyDeleteI've been trying to run some code on my own (R) to get trend uncertainties for some time series data but i'm finding it buggy. Is there somewhere on your website where I can find code or how to estimate trend uncertainties for time series data?
Question answered at TAV
Delete