TempLS showed a very small rise in global mean anomaly in December, from 0.358 °C to 0.364 °C. Now NOAA and GISS are out. NOAA has a slightly larger rise, from 0.437°C to 0.457°C. And GISS has a small fall, from 0.48°C to 0.45°C. All these are relative to their respective base periods. Time series graphs are shown here
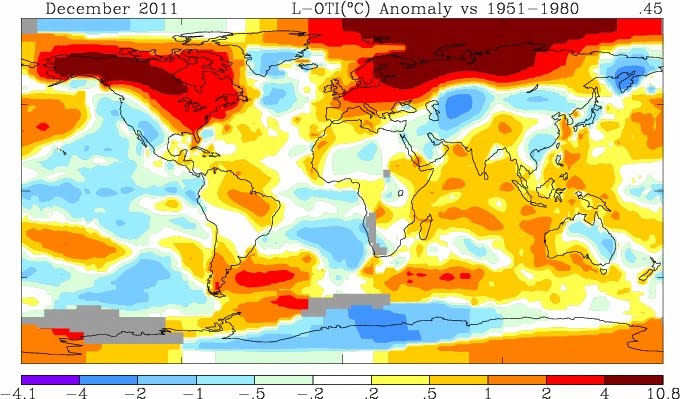
As usual, I compare the previously posted TempLS distribution to the GISS plot. Here is GISS:
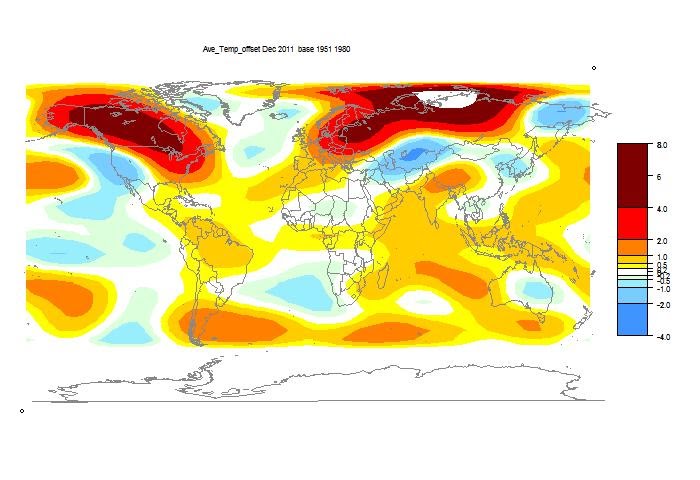
And here is the TempLS spherical harmoics plot:
Previous Months
November
October
September
August
More data and plots


0 comments:
Post a Comment