I wrote here about the somewhat related "Temperature drives CO2" meme. And I wrote here a few days ago about a weird revival, involving a total misreading by blogger Hockey Schtick of a recent paper on local CO2 perturbations, and the vanishing of that thread.
Vanishing is a relative term nowadays, and sure enough, the story reappeared at WUWT as if nothing had happened. Various oddities ensued; HS turned up to say that his thread hadn't been canned; it was only resting. And the original author, Denica Bozhinova, turned up to say some of the things that had been disappeared at HS. Her paper had been grossly misinterpreted.
Anyway, the usual folk continued as if nothing had happened, with the usual story that natural fluxes greatly outweighed human. I responded thus. But the most direct refutation is the simple graph of mass changes over the years. This is too rarely seen, though there is a good article and plot at SkS, which I cited.
So I did my own. Emissions data (including cement making) is from CDIAC, including BP estimates for 2011 and 2012 (no 2013 yet). CO2 ice core data from Law Dome (Dethridge, via CDIAC), and recent from Mauna Loa Scripps, using annual averages. I converted ppmv to Gt C using the factor 1 ppm CO2 = 2.13 Gton C. I found the following units conversion table useful:
| Gtons C | Gtons CO2 | ppmv CO2 | |
| 1 Gton C= | 1 | 3.666 | 0.433 |
| 1 Gton CO2= | 0.272 | 1 | 0.128 |
| 1 ppmv CO2= | 2.13 | 7.81 | 1 |
Here is the plot:
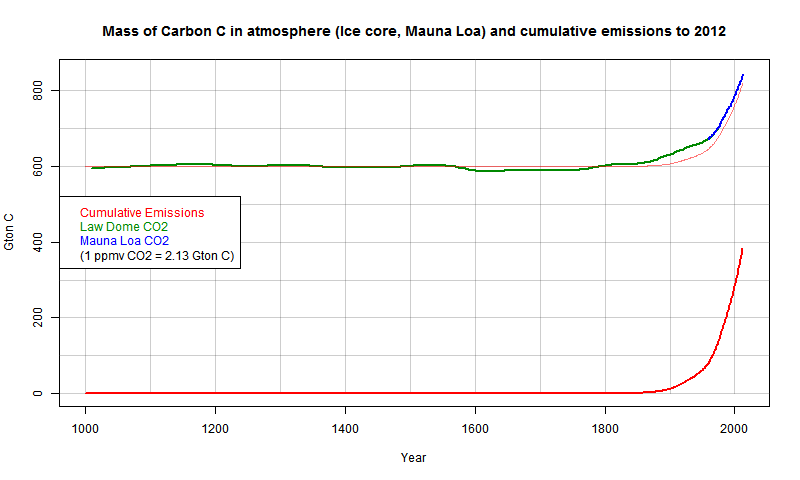
Update - I've added a pale red echo of the emissions curve, displaced to match pre-industrial, and multiplied by the factor 0.57 used by Scripps (see below) to account for airborne fraction. You'll see that the air CO2 starts to rise a little earlier. This is likely the effect of land clearances.
It must be really hard to sell the story that the CO2 response is just natural variation, nothing to do with what we emitted. I'll show more plots below the jump.
Here's a plot just since 1800, for better resolution

And here is the SkS plot (units Gton CO2):

Here is a plot from Scripps Details here:

It shows how the curves superimpose with a constant airborne fraction factor. Smooth version here.


The atmospheric mass of CO2 rises earlier than the fossil fuel emissions, probably due to deforestation. Maybe you can add a graph of the (cumulative) deforestation carbon emissions to check this?
ReplyDeleteYes, I'll do that. There are estimates from Houghton at CDIAC. I'll make another post, since these estimates bring their own uncertainties. But they do account for that gap, and also allow a more conventional factor for airborne fraction. They also seem to provide an answer to the common complaint about how come there was warming in the early 20Cen with much less FF use. FF+land clearance was not so much less.
DeleteIt may not be just deforestation, the clearing of unforested land for farming in the US and Australia would increase CO2 emissions. Cleared land and grasslands behave differently.
DeleteNice work, Nick.
ReplyDeleteIt looks to me like Fig. 2 shows that CO2 sequestration (sink rate) has been increasing faster than emissions.
Oops, meant to say that Fig. 2 more clearly shows...
DeleteIs airborne fraction going down? Some say maybe yes, others maybe no. It has been fairly stable.
DeleteAdding land use effect (as I plan to) makes some changes to the appearance. Deforestation etc is still adding CO2, but not increasing as fast as emissions.
Hi Nick,
DeleteI think that deforrestation was certainly responsible for some of the earlier increase in CO2. However I think there is some evidence for a modest drop in the fraction of newly emitted co2 which remains in the air; this may be in part due to more rapid plant growth, and in part to longer growing seasons, and in part to greening of marginal land from increased CO2. It will be interesting to see if the fraction has changed much after you account for decorrestation.
Stephen,
DeleteI've put up a new post which includes Houghton's estimates of land use addition of CO2 to the air. It improves the correspondence. I've also shown an airborne fraction calculation, in terms of FF ermission alone, and land use. In each case, it seems the proportion retained in the air is remarkably stable.
pre-1900: Bill Ruddiman's Earth Transformed (2013) or for a quick intro, see his Tyndall Lecture @AGU. That pretty well explains why:
ReplyDeletea) CO2 stayed in a narrow band for most of 8,000 years (it happens that via agriculture/deforestration, we were nullifying the normal downtrend for both CO2 and CH4.
b) Human plagues contributed to some of the down-jiggles since 1AD, most visibly in the ~9ppm drop 1525AD-1600AD, caused by 50Mperson die-off in Americas and reforestration.
Thanks, John. For completeness I could use some pre-1850 data.
DeleteLink to book seemed broken temporarily, seems to be fixed now.
DeleteChapter 19 is about the CO2/CH4 drop into 1600AD.
nick,can you explain to me the mechanism that creates a steady increase in atmospheric carbon dioxide since the late fifties (shown here http://co2.cms.udel.edu/Increasing_Atmospheric_CO2.htm ) if this increase is attributed to anthropogenic sources when the greatest proportion of anthropogenic carbon dioxide has been released in the last 25 years http://www.skepticalscience.com/co2-levels-airborne-fraction-increasing.htm surely we should see atmospheric carbon dioxide increasing at a vastly accelerated rate ,not a steady year on year increase ?
ReplyDeleteAnon,
DeleteThere is no mechanism problem. Our emissions have always, for the last hundred years at least, well exceeded the increase of CO2 in the air. The ratio of that increase is the airborne fraction, and has been in the range 40-50%. You can see how uniform the correspondence has been from the Scripps plot that I showed.
But there is something extra - the component from land clearance. This was relatively more significant in the 1950's. It's a smallish effect, but I'll post new plots including it soon.
it is the uniformity of the rise i do not understand nick. surely the last two decades should show a marked increase,not the near linear increase the plots show ?
Deletenot the near linear increase the plots show
DeleteIt can be hard to discern relatively slow exponential rise. I've shown in the next post plots of air CO2 vs anthro additions. They really are linear.
Nick: Not all that added CO2 in the air is man's. If you had plotted the seasonally adjusted Mauna Loa CO2 data, you would see that there are fluctuations in the rate of increase in CO2 that appear to depend on temperature. During the strong 97/98 El Nino, the increase was about 75% greater than normal. During the La Nina that followed, the increase was 30% lower than normal. (June to June figures).
ReplyDeleteIt seems likely that the temperature and CO2 content of the mixed layer move in parallel on a monthly or quarterly basis. The deeper ocean responds much more slowly (millennial time scale) to changes between glacials and interglacials.
You wrote: "I've added a pale red echo of the emissions curve, displaced to match pre-industrial, and multiplied by the factor 0.57 used by Scripps (see below) to account for airborne fraction. You'll see that the air CO2 starts to rise a little earlier. This is likely the effect of land clearances."
This is the typical alarmist position: man is responsible for everything that happens. A few narrow-minded skeptics want to blame nature for everything. The truth lies somewhere between, though in this particular case (CO2) man is obvious responsible for the bulk of the change. Looking at the discrepancies in your overlay plot, I'd suggest that some of the increase in CO2 in the 1800s could due to the warming that end the LIA, that some of the increase in the 1900's could be due to warming during this century (at least some of which is due to man). It isn't clear if the drop in CO2 around 1600 can be attributed to the LIA. (Other plots seem to show a bigger drop than yours: http://www.esrl.noaa.gov/gmd/images/icecore.png) Since the Industrial Revolution, the big picture might be something like this: a) Warming has released the equivalent of 20 ppm equivalent of CO2 from the ocean. b) Man has emitted the equivalent of 180 ppm of CO2. c) Enhanced uptake driven by higher levels of CO2 in the atmosphere has taken up the equivalent of 80 ppm of CO2. Since man is responsible for the bulk of the rise, we might call these: natural emission, anthropogenic emission, and anthropogenically-enhanced natural uptake.
Frank
"This is the typical alarmist position: man is responsible for everything that happens. A few narrow-minded skeptics want to blame nature for everything. The truth lies somewhere between, though in this particular case (CO2) man is obvious responsible for the bulk of the change."
DeleteSo is it an alarmist position? This post is just trying to make that responsibility obvious. We see more CO2 in the air - we know a whole lot was put there. The faint red is trying to see whether they match. Seems like regular science to me.
The match is better if you include land clearance. Next post.
I said that the alarmist position is to always blame everything on man and the narrow-minded skeptical position is that nature or natural variation is responsible for everything. Glacial periods when the average temperature is 5 degC colder have reduced CO2 by about 100 ppm. With more than 1 degC of warming since the Industrial Revolution (some of which is associated with the end of the LIA), we should expect to observed a temperature-dependent release of CO2 equivalent to more than 20 ppm. The time period over which this release will occur is uncertain, but release from the mixed layer should be rapid.
DeleteChallenge: Plot the change in the seasonally adjust CO2 at Mauna Loa vs the change in SST anomaly. Then tell us that temperature change doesn't modulate the accumulation of CO2 that is being mostly driven by man.
Frank
Frank It is well known that there is a correlation between variation in SST and atmospheric CO2, which seems to have been first noticed by Bacastow back in the 1970s. The mechanism seems likely to be due to ENSO affecting precipitation and hence the growth and die-back of vegetation in the Americas. The idea that this correlation means that the long term rise in atmospheric CO2 is plausibly a natural phenomenon has been raised a number of times, most recently by Prof. Murry Salby. I explain the mathematical error (correlations are not sensitive to the mean values of the signals, but it is the mean value of the CO2 growth rate that gives rise the long term trend) in his argument in an article at SkepticalScience.com
Deletehttp://www.skepticalscience.com/salby_correlation_conundrum.html
That article also gives links to the paper by Bacastow and a later study that discusses the reasons for the corellation.
This article http://www.skepticalscience.com/roys_risky_regression.html discusses a similar argument made earlier by Dr Roy Spencer, which contains the plots you suggest, and explains why the correlation doesn't explain the long term rise in CO2. Again the error lies in the fact that it is the mean value of the growth rate that gives rise to the long term trend, the correlation only explains a minor modulation superimposed on top.
Right, as to the glacial/interglacial changes in temperature and CO2. The reason for this is normally stated as being Henry's law, which says that increasing temperature decreases the solubility of CO2 in water. This is true, however Henry's Law states that the solubility of CO2 in water is proportional to the difference in partial pressure of the gas in the atmosphere and the concentration in the water, the constant of proportionality being sensitive to temperature. Now if all things remain equal, an increase in temperature will result in a change in CO2 of the order you suggest. However, things have not been at all equal, in that anthropogenic CO2 emissions have caused an increase in the partial pressure of CO2 in the atmosphere, relative to the oceans, and Henry's Law tells us that this should have produce an *increase* in the solubility of CO2 in the oceans. Which of these factors wins out? The data clearly show that the increase in partial pressure dominates, as we know that the carbon content of the oceans is increasing (e.g. ocean acidification). We also know that the natural environment has been a net carbon sink for at least the last half-century, and that the magnitude of the net environmental sink has been steadily growing over that period (see SkS articles for details). This is clearly inconsistent with the argument that nature has been contributing to the rise in atmospheric CO2 via oceanic degassing.
Now it is not "alarmist" to say that the rise in atmospheric CO2 is anthropogenic. This is what multiple lines of scientific evidence tell us (http://www.skepticalscience.com/anthrocarbon-brief.html). The bizarre things is that this simple fact is not accepted by some climate skeptics, even though the evidence is unequivocal, and simple enough to understand that anybody capable of managing a bank account should see it immediately. Atmospheric CO2 has risen at a rate less than the rate at which anthropogenic emissions are adding it to the atmosphere. This means that the natural envrionment must be a net carbon sink, and hence is actively opposing the rise.
I wrote a paper that addresses a number of common mis-understanings of the carbon cycle in the hopes that it would go some way to ending the constant discussion of this issue so that the debate could make better progress. You can find it here: http://pubs.acs.org/doi/abs/10.1021/ef200914u I'd be happy to discuss this further, either here, or at SKS.
Vikram: Thanks for your thorough reply. I've been away and unable to answer.
DeleteIt is counterproductive to ignore that warmer oceans hold less CO2 than colder ones because the solubility of CO2 diminishes as temperature rises. Spencer's correlation between delta[CO2] and temperature demonstrates that this phenomena and the 100 ppm rise in CO2 at the end of the last ice age both demonstrate the practical importance of this phenomena. Rather than denying that some of the increased CO2 now in the atmosphere came from the rise in ocean temperature over the past century, we should be asking HOW MUCH came from the warmer ocean! Based on the fall in CO2 at the start of the LIA, I estimated that 20 ppm could have come from the ocean; about 10% of the 180 ppm released by using fossil fuels and limestone. The correct value could be smaller if other factors contributed to this fall.
Nick can try to match the historical record for CO2 perfectly by using ESTIMATES of anthropogenic emissions, land use, and an "airborne fraction" fudge factor; but the data isn't reliable enough to rule out a modest role for CO2 released from the ocean.
As best I can tell, both your post (www.skepticalscience.com/roys_risky_regression.html) and Roy's post (www.drroyspencer.com/2009/05/global-warming-causing-carbon-dioxide-increases-a-simple-model/) are flawed. I can't tell where you went wrong, but your Figure 7 shows the SST component of CO2 falling from 1960 to 1980, a period when ocean temperatures rose. This can't represent CO2 emitted by a warming ocean.
It is easier to see where Roy went wrong. His model was:
delta[CO2]/delta[t] = a*SST + b*Anthro
This model says that the ocean will emit CO2 forever at a constant SST. Absurd. I'm interested in a model for the release of CO2 from the mixed layer of the ocean. Since heat from the surface (SST) reaches the mixed layer within several months, CO2 can be released by this heat in roughly the same time period. So my model would be:
delta[CO2]/delta[t] = a*delta[SST] + b*Anthro
Spencer shows that a short lag may help. Even this model is flawed since b includes the air-borne fraction fudge factor, rather the full anthropogenic emission minus the enhanced uptake driven by rising CO2 levels.
The 97/98 El Nino produced roughly an 0.2 degC rise in SST and a 1.5 ppm larger than normal rise in seasonally-adjusted CO2. So "a" might be in the vicinity of 7.5 ppm/degC for the rapid release of CO2 from the mixed layer. Over longer time periods, some CO2 will be released from the deeper ocean, but we know from the LIA that this amount can't be anything like the 120 ppm rise we have observed.
Frank
Frank,
DeleteApologies for this being delayed in moderation. It isn't you or anything you said. Posts more that 3 weeks old go into moderation (I'll change this). And I've been a bit under the weather with a cold.
Nick: No problem. I didn't think you would object my post, but I did wonder what happened. I submitted or tried to submit this twice, so you may find a second similar comment waiting for moderation. The second should be discarded.
DeleteFrank
You are confusing the jiggle for the juice. There are changes due to global temperature, the fall of the Soviet Union, the 2008 recession and more, but overall the trend and the amounts correlate to human emissions quite well. Of course, you also have to look at the changes in O2 mixing ratios (at the ppm level) which ALSO correlate with the amount of combustion.
ReplyDeleteTry it somewhere else
Eli: As long as we are both saying that global temperature change modulates CO2 to some extent, we are in agreement. However, I quantified my estimates: 10% of the rise is due to warming, 180% due to man (fossil fuels and limestone), and -70% due to "anthropogenically-enhanced" natural uptake. If you believe other values are more accurate, tell us what they are and explain.
DeleteFrank
Surely you mean CO2 modulates temperature ? Well until 18 years ago??
ReplyDeleteNick,
ReplyDeleteIf I use CDIAC global emissions data from 1750 then integrate cumulative emissions together with the BERN annual impulse model I get the following.
http://clivebest.com/blog/wp-content/uploads/2016/12/BERN-ML-Detil.png
I initialise at 1750 with CO2=280ppm. It implies that before about 1950 100% of emissions were retained in the atmosphere. as the CO2 curve intersects with cumulative emisions.
The get-out clause then seems to be that land change from 1750 to 1950 enhanced emissions just enough to agree with the Bern model. Is this correct? How well do we know what land change 'emissions' really were or why for example massive deforestation in Europe and Asia well before 1750 seemingly had no effect?
Clive,
DeleteI think land use emissions are the key here - I took them into account in a follow-up post. I think they do explain the 100% paradox.
I'm sure forest clearing pre-1750 had a small effect at that time. 1750 onward is the conventional time frame for accounting for anthropogenic activity, because it embraces fossil fuel mining. And as seen here, it does include almost all the observed rise.
Thanks - I now included Houghton land change 'emissions'! They do explain the paradox of why CO2 levels apparently exceeded cumulative emissions, and then the Bern model more or less reproduces atmospheric CO2 levels until 1950. Thereafter though it fails rather miserably, so something is wrong in my opinion. I will write a post about it in the next few days.
ReplyDelete