Sunday, April 4, 2010

More GHCN results.

I've put up version v1.1 of my least squares GHCN code. It now makes it possible to easily analyse subsets using any of the information on the inventory file. I've used it to calculate a number of much discussed examples. The code now runs very fast. On my fairly old PC, the biggest case (global) takes less than 100 secs. So although each special case is calculated pretty much from scratch, there's not much penalty there. The code is here, and also on the document repository.

New code features.

The program has now been split into two. The first is a preprocessor which reads v2.mean, does the merging of duplicates, and prints a condensed file called v2mean.txt. Unlike ver 1, it doesn't require prior editing of v2.mean. The idea is that once you have merged the duplicates, you don't need to do it again un til you want to deal with a new version of v2.mean.

The second part is somewhat like V1, but much more clearly laid out. It's even shorter (with the preprocessing gone) - about 170 lines. There's a lot of infrastructure with printed tables, plots with trends etc.

The selection process works thus. The 18 parameters from the .inv file have been given names, like tv.$country, listed in colnames. You declare a list of names that you'll want to use and have appear on graphs etc: 
title = c("Globe","NH","SH","ConUS","Airport","Rural","Urban"); 
choices = 1:7 #c(4,5,6,7);

In the second line, you declare the ones you want to run.
The logic of the choices is expressed in the list:
if (tc == "NH")   i01 = i01[cellnums>1296]; 
if (tc == "SH")   i01 = i01[cellnums<1297]; 
if (tc == "Airport")  i01 = i01[tv$airpt == "A"]; 
if (tc == "Rural")   i01 = i01[tv$urban == "A"]; 
if (tc == "Urban")   i01 = i01[tv$urban != "A"]; 
That's my current list, but you can change it.

Some results

Firstly, a table of trends, in deg C/decade.
TrendsGlobe....NH........SH.........Airport..Rural...Urban
No. Stations..728060561224239027124568
1900-20090.07600.08240.06900.05960.06060.0752
1978-20090.27170.31440.11060.26280.25610.2631

No real surprises. The main outlier is the SH, but remember, this is land stations only. The classifications of airport, rural and urban make little difference. The urban/rural differentiation is by night lighting, and I've included small towns with urban.

Remember that this is based on raw GHCN data, with no corrections made by me.

Update - there was a bug in V 1.1, which had a minor effect on the results, but which could cause a crash. It didn't affect global calcs - only subregions. Here are the recomputed trends:
TrendsGlobeNHSHAirportRuralUrban
No. Stations728060561224239027124568
1900-20090.07600.08330.04790.06610.06780.0761
1978-20090.27170.32970.11990.24380.25990.2721
I'll fix the posted code in all locations, calling it v1.11, and the results file.

I've posted the results file on the document repository.

Some plots


NH 1900-2009

SH 1900-2009

NH 1978-2009

SH 1978-2009

Rural 1900-2009

Urban 1900-2009

Rural 1978-2009

Urban 1978-2009

Airport 1900

Airport 1978


Wednesday, March 31, 2010

Comparison of GHCN results


I promised some comparison plots from the code reported in the last post, but Zeke has made the task much easier. He posted a spreadsheet with all the data nicely arranged, and I added my own data - you can find the spreadsheet "Temp Comps_NS.xls" in the drop.io repository.

Below are some of the plots and discussion.

A summary of this series of posts is here.

Here is the global data from 1880 ( or 1881 in my case). Details of the sources are on Zeke's post. All data is set to zero average in 1961-90.


And here is a close-up of the period 1960-2009.


The agreement is good. This is encouraging, because the principle of the least squares method is very different, and bypasses all the merging of stations issues. Of course, the agreement of all the other reconstructions is also impressive.

Here is a plot with just the main indices GISS and Hadcrut:


GHCN processing algorithm

As Zeke says, it seems to be a custom now for bloggers to post codes to grid GHCN data and calculate trends. Here's my offering. It's influenced by Jeff Id's program, and particularly by Romanm's Least Squares. In fact, it's an extension of Roman's offset method to the whole global set. It's fairly different to the conventional approach. It doesn't actually do gridding, or (per Roman) calculate anomalies. It's probably the shortest of the codes, and runs quite fast.

A summary of this series of posts is here.

The linear model

I'll attach a pdf file explaining the mathematics in more detail (soon). But here's a sketch. The monthly data, from v2.mean after averaging over duplicates, is in a big array x(S,m,y). The indices are station, month and year.

The model is that x can be represented in terms of a global temperature G(y) depending on year alone (not month or station) plus a local offset L(S,m) for each station S, with a seasonal component dependent on month m (but not year), plus error:
x(S,m,y) = G(y) + L(S,m) + eps(S,m,y)
I do a least squares weighted fit.

The weight function w(S,m,y) is inversely proportional to area density of stations, and of course, zero for (S,m,y) combinations where there is no data. So we're minimising (Latex-like notation) Sum_{S,m,y} w(S,m,y)*(x(S,m,y) - G(y) - L(S,m))^2

Weighting

The weight function uses a grid. But it just counts stations in each cell - no explicit grid averaging is done. The count is for each month (and year). The cell area is divded by this count to give wt(S,m,y). A conventional 5 deg x 5 lat/lon cell is used.

The design matrix system

Minimising LS gives the system
L(S,m)*Sum_{y} w(S,m,y) + Sum_{y} {w(S,m,y)*G(y)}
            = Sum_{y} {w(S,m,y)*x(S,m,y)}

Sum_{S,m} {w(S,m,y)*L(S,m)} + G(y)*Sum_{S,m} w(S,m,y)
           = Sum_{S,m} {w(S,m,y)*x(S,m,y)}

Regarding (S,m) as a single index, this is actually a symmetric system:
A1*L +B*G = R1
t(B)*L +A2*G = R2

A1 is the very big block, but is a diagonal matrix. t(B) is the transpose of B. A2 is diagonal too.

Solving

This can no doubt be solved (for local L and global temp G) using R's lm() type functions. Numerically, it is essential to take advantage of A1 being diagonal. I don't know how R can do that, and would appreciate advice.

I constructed a home-made block solver which was quite fast and apparently effective (although I have an idea for a faster version). A wrinkle is that the matrix is singular, because you coould add any constant to the global temp G and subtract it from L. So I added an equation to fix the initial G to zero.

Testing

To test the code, I created a synthetic data file with the v2,mean format, but made up of just a trend with a sinusoidal temperature (same for all stations), with a random scattering of missing data. It should give an exact answer, and it did. The test code is included here.

Results

I haven't tried hemispheres, yet, just global. I'll show in a following post comparisons with HADCRUT etc. For the moment, I just looked at global temps and trends from 1900 to present, and 1978 to present. I was particularly interested to compare with Jeff's value of 0.2476 C/dec. Here's my fig, with the result 0.2542 C.dec. (The AR1 correction is coming).

For 1900-2009, my slope is 0.0747 C/dec - well within Zeke's range.

Code and next steps

The code, and the test code, is in the repository. In a future post, I'll show results for the local seasonal temperatures from the LS fit - they are pretty interesting too.

Thursday, March 11, 2010

On Polynomial Cointegration and the death of AGW


Well, I never thought I'd write a post with such a title. And I must confess that until about two weeks ago, these terms were very foreign to me. But recently, a paper by the econometricians Beenstock and Reingewertz has been circulating among sceptic blogs. It seems unpublished, but with the file called "Nature_Paper091209.pdf" there has been some jumping to conclusions. There was a brief discussion at WUWT, and more recently, David Stockwell has run a series on the topic.
  
Update.  Bart has commented has commented and linked an interesting discussion on his blog. Tamino has taken this up with a very thorough discussion (with sequels). The first properly sceptical discussion of the Beenstock paper was by Eli Rabett. 

Further update. VS has noted that the much more significant thread on Bart's blog (now much discussed in itself) is here.

Ringing phrases like:
"Therefore, greenhouse gas forcings, global temperature and solar irradiance are not polynomially cointegrated, and AGW is refuted."
ensure that those who like that sort of thing will keep it going for a while, so I thought I should try to figure it out. I'm still not an expert, but I hope what I did figure out might help.


Time series and unit roots


The theory is derived from the abstract notion of modelling a stochastic time series by a recurrence relation:
y_t + c1*y_{t-1} + ... + cn*y_{t-n} = ε_t
where ε_t is a stationary stochastic variable with zero mean (serially uncorrelated, constant variance).

This can be re-expressed symbolically using the backward difference operator
Dy_t = y_t-y_{t-1}
(a0 + a1*D + a2*D^2 +...+ D^n) y_t = ε_t
This is just binomial algebra

This is the undriven form, but a non-stochastic driver could be introduced. The corresponding non-stochastic recurrence relation (with ε_t=0) has n power solutions of the form b^t (t=0,1,2,...), and the b's are solutions of a characteristic n-th order polynomial. It is expected that these will all have magnitude not greater than 1, otherwise the process would have blown up.

The case where one or more roots are equal to 1 is called the unit root. It's important because the behaviour is qualitatively different. Instead of disturbances decaying with time, the process can just wander. It is a random walk.

Testing for unit roots


The point of the second difference form is that there is a clear criterion for unit roots. There is one root if a0=0, and the series is called I(1). There is a repeated root if a0=0 and a1=0, and the series is called I(2).

Now although people who like this sort of thing like to talk of asymptotic behaviour, there is usually no known underlying mechanics to justify this. There is just a finite period of observations. So the coefficients are never completely known (or of course, even whether it is an exact model). You can't get true asymptotics from a finite observation period.

So you can never say that a0=0. All you might be able to say is that a0 is bounded away from zero - significantly different at some level of confidence, say 95%. That's a test, and variants include the Dickey-Fuller test, and the augmented ADF test.

So when you say a series is I(1), you are saying that a test failed to yield significance. You weren't able to show, at 95% confidence, that a0 was different from 0. That's a negative conclusion, and certainly doesn't mean that you're 95% confident that the series is I(1). You're not 95% confident of anything.

In fact it's hard to quantify confidence in I(1) status in any way. Higher levels, eg I(2), likewise say that we weren't able to show that both a0 and a1 are significantly different from zero. Two failures is even harder to express as a confidence level.

Cointegration


This is used in causal arguments as follows. If, say, a temperature rise is believed to be caused by a CO2 rise, then there is a consistency requirement for the series. The long-term qualitative difference between a series with roots less than unity, and one with unit roots is great. So it would be odd to find that if temperature is I(1), so its a0 = 0 but a1 is not 0, while for CO2 (with coefs b0, b1 etc) b0 = b1 = 0. For that would mean that the temperature differences were stable, with disturbances decaying, even though the corresponding differences of CO2 could drift. That's the supposed significance of the failure of "polynomal cointegration". Though its still a big jump to say "AGW is refuted".

For let me say again, we can never be totally confident, on finite data, of statements about I(1), I(2) etc. But we don't seem to be able to quantify our uncertainty. Even less can we quantify compound statements like T is I(1), CO2 I(2), therefore incompatible.

Back to Beenstock


So how do B&R quantify their claim that AGW is refuted? Explicitly, not at all. I didn't see any confidence level attached to it. They did describe a number of tests on the CO2 series. That is, they quantified the extent to which they can say that the test for non-zero b0 and b1 failed. But oddly, there seemed to be no test statistics at all on temperature. They just said that it is I(1), apparently relying on papers by Kaufmann and others. But no confidence level was cited.

So with no quantitative confidence in one of the parts of a compound proposition, with what confidence can they say that "AGW is refuted".

They go on to make even more remarkable claims
Although we reject AGW, we find that greenhouse gas forcings have a temporary effect on global temperature. Because the greenhouse effect is temporary rather than permanent, predictions of significant global warming in the 21st century by IPCC are not supported by the data.
Again, with no physics but just a century or so of observations, they are able to say what is temporary and what is permanent.


Saturday, March 6, 2010

A blatant fiddle in the D'Aleo/Watts SPPI report.

The D'Aleo/Watts report has come under justified criticism for it's silly claims about marching thermometers etc, amplified into claims about malfeasance by various scientific groups.

But there's one little thing that particularly bugs me, because I have pointed it out more than once, but it makes no difference. They say  

"See the huge dropout of data in Africa, Canada and Siberia in the two maps from NASA GISS with 250 km smoothing from 1978 to 2008"

and show these pictures:


Well, yes, quite a reduction in going from 1978 to 2008. But actually, if you go to the GISS site and ask for April 2008, what you see is not nearly as sparse.


So what is going on?

I managed to track down where the SPPI image came from. Bob Tisdale has a version of it in a post dated May 20 2008. It's an early version (current when he posted it), made with an early batch of data that came in for that month. And it's compared with the full version of April 1978.

It's a bit like that Langoliers post. But it just keeps turning up.

Tuesday, February 23, 2010

GISS UHI adjustments


Yet another fevered analysis on adjustments from Willis Eschenbach, this time on GIStemp in Alaska. As usual, everything that he doesn't understand means someone is fudging ("Fudged Fevers").

Ironically, there was huge pressure from sceptics that led to GISS to completely release their code and data some years ago. They may have hoped that the fudge fans would at least look at what is in the code first to find where it's done. But no.

The adjustment in question is GISS's way of dealing with the Urban Heat Island effect. The sceptic chorus is that measured warmth is an artefact of measurements being taken near cities, at airports or whatever. There is indeed a UHI, and here's what GISS does about it.
GIStemp information

Update Apparently an issue now is whether GISS erred badly in classifying Matanuska AES as urban according to satellite-observed night brightness. I have added below a satellite map pic of Matanuska AES. It's not far from Wasilla. It is in fields, but about 1 km from a major freeway intersection, and about a mile from what looks like a car sales lot.

GISS adjustment principle


They now estimate the urban status from satellite brightness. This is a good idea, because brightness correlates well with energy usage, which in turn matches the waste heat that causes UHI. It's also more precise, because you can see where the stations are relative to the brightness. And their adjustment has the general effect of removing the trends from urban stations and replacing them with a trend inferred from nearby rural stations.

The weighted average they use tapers with distance, and reaches out to 1000 km from each urban station. If more rural stations are available, they will reduce the radius to 500 km. When they have the trend of this average, they make a difference of that with the urban station and add it. The resulting station has its original ups and downs, but the trend of the rural stations. And when you make a global average and look at the trend, the ups and dowwns are smoothed away, and the global trend is made up entirely of rural stations.

Well, almost. They allow for the possibility that stations which now have bright lights may have been rural at some time in the past. So instead of fitting a simple line, they allow the line to have a "knee" with a slope change.

The Alaskan examples.


Willis chose two stations - Anchorage (a city) and Matanuska, which was rural until recently. Both these are now classified from the brightness test as urban.

His Anchorage plot

is actually straightforward. It slopes downward uniformly, suggesting a regular UHI warming. If the correction is made, the global warming trend would be less. He queried the steps, but this just reflects the fact that station temperatures in GISS are rounded to the nearest 0.1C (and stored as integers). His main complaint was that the slope did not curve with the population growth. Indeed it is a little surprising that the algorithm did not insert a "knee". However, it makes little difference to the inferences that are made about global warming, since inexactitude about when UHI was at its peak tends to even out over many stations. Other cities had their peak growth in those years.

His complaints then focussed on Matanuska. Here's his plot:
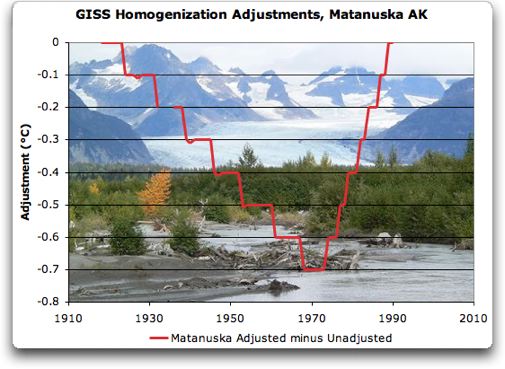

Here the complaint is of the steepness of the rise, which reflects an anti-UHI adjustment, and, I think, the fact that in the end no nett adjustment is made.

A GISS emulation.


I've written a poor man's GIStemp adjustment program - you can find the code here. It reads data from the GHCN v2.mean and the GISS v2.inv inventory file. You choose a "target" urban centre. It first scans the v2.inv to work out which stations are within Rad distance - Rad is usually 1000 or 500 km. It then scans the big v2.mean file to locate the rows that come within range, and in the process works out monthly averages for each station over its data range. With duplicates, the rule is that for any year it takes only one value per station, which is the first one encountered. Note that these averages do not relate to a fixed time period. If we were looking further afield, that would be a problem, but it's OK for the neighborhood of a single city.

The next loop looks over the same rows from v2.mean, but now we know which ones to choose. An anomaly is made by subtracting, for each station including the city, the monthly mean. That makes it possible to replace missing values by zeroes, which avoids seasonal distortion. Then the distance-weighted annual average of rurals is created, and from it, the annual values for the city is subtracted to make corr[], the correction vector.

Next the line-with-knee fit is done, using lm(), Every possible knee location is tested, and the one with minimum RSS chosen. Finally it is all plotted.

Matanuska.


OK, here's our Matanuska plot. It shows the city reading in red, the rural average in green, and the difference in black. Note that if we added the black curve as a "correction" to the red one, it would completely replace it by the green curve. No info from Matanuska would go into the global index. If UHI had been suspected, it's gone.

But in fact GISS fits the line segments as shown, and adds that. That has the same effect on trend, but leaves short-term signals. I'm not sure what the benefit of that is.

Comparing this plot with GISS, the knee comes a bit later, and the late rise is even steep er (a HS?). The earlier downslope is less pronounced.

Commenters at WUWT asked why this location was being adjusted at all, as it isn't obviously a big city. The answer is that GISS uses the objective satellite brightness criterion, and I'm sure those folks at WUWT would object if GISS replaced that with subjective judgements. But it may indeed be a false positive - does that matter? Not much; as long as enough rural stations remain, it doesn't matter unduly if a few were removed without necessity.

Update: Matanuska on the map:

The AES is near the top right

Anchorage.


Here's a difference - I do get a slight knee. But it isn't very pronounced. As a numerical matter, the change of RSS with the knee/no knee options is quite small. Otherwise again we see the fairly long descent, corresponding to the expected UHI correction.

Let me emphasise again that this GISS correction does not leave Anchorage with a merely modified trend - it replaces the trend with that of rural stations.

Code and algorithm.


Again, the R code is here. I'll write more about the algorithm soon, and with details from the GIStemp code. For the moment though, I'll just reprint some comments I posted at WUWT.

On the GISTEMP code
The relevant parts of the code are in directory STEP2 of the GISTEMP source. The first thing to note is the file v2.inv in ./input_files. It lists the station data, and for the two Alaska stations:
42570273000 ANCHORAGE/INT__________________ 61.17 -150.02__ 40____8U__173FLxxCO 1A 5WATER__________ C__ 53
42570274001 MANTANUSKA AES__________________61.57 -149.27__ 46__225R__ -9FLxxCO30x-9TUNDRA__________C__ 18
The second last number gives the GHCN brightness rating - C is highest. So both will be adjusted.

The adjustment is done in the subroutine adj() of padjust.f. Temperatures are held as integers, to tenths of a degree - 121 is 12.1C. The relevant code fragment is:
____ do iy=iy1,iy2
________sl=sl1
________if(iy.gt.knee) sl=sl2
________iya=iy
________if(iy.lt.iy1a) iya=iy1a
________if(iy.gt.iy2a) iya=iy2a
________iadj=nint( (iya-knee)*sl-(iy2a-knee)*sl2 )
iy is the year. You'll see that there is provision for a "knee" and two slopes (switching at the knee). There are also limits beyond which the adjustment will be held stationary.

So the effect of the "nint" is that the adjustment is piecewise linear, and forced to the nearest integer value - ie 0.1C.

So now you can see where those plots come from. Anchorage has no knee, but just a steady slope adjustment, made stepwise by the nint. Mantanuska has a knee, and a steep slope following the knee.

The rationale seems to be that a broad slope correction is made to match the city to have the trend of its rural surrounds. The knee is presumably to allow for a transition in the past from rural to urban.

More on the GISS Fortran

More on the algorithm used. In PApars.f they compute, as they stated, for each urban station (in the do 200 loop) the AVG() of yearly distance weighted average values of nearby urban stations. They then calculate the difference between that and the urban values URB(). This information is passed to getfit() in t2fit.f (via the common block FITCOM).

In getfit, the line-with-knee fit to AVG-URB is laboriously computed by trying every possible knee (within 5 yrs of the end of range), and choosing the value with least residual SS (in trend2(), tr2.f). The resulting slopes and knee are what ends up in the adj() routine set out in my previous post, and with the jaggedness of integer conversion become the plots shown in the head post here.

Thinking a bit more about the method GISS is using. The plots Willis has shown are just approximators to the difference between the "urban" station and the weighted average of surrounding "rural" stations. If you think there's something extreme about them, it's probably not in the adjustment arithmetic - it reflects the actual behaviour of that difference. There's nothing particularly bad about a LS fit of a bent two-line segment.

Adjustment vs Omission
So what does the adjustment achieve? Suppose you put more effort into getting a better approximator to the difference. In fact, you could just use the exact difference. That would completely replace the urban station result with the average of surrounding rural. The eventual global trend would then be just provided by rural stations. That is good if you have enough of them.

So why include the urban stations in the calc at all? They have an odd effect - by putting them in, and then replacing them by the average of local rural stations, you upweight the effect of those local stations in the global average. This probably wouldn't matter much, and the effect is further muted anyway by the gridding.

The piecewise linear approx leaves a small residual effect of the urban stations in the global average, but only contributing short-term variation. The trend effect has been removed. And since the short-term effects are almost totally lost in the averaging, it seems to me that there's little difference between GISS UHI adjusting and leaving out urban stations completely.  

Update - Orland Ca Steven, in comments, asked for a run of Orland Ca, which is another station classified urban, but arguably not. Here's the plot:


Further update
I've plotted the number of rural stations used in the Orland calc, along with the weighted sum, in each year. The weighted sum counts each one multiplied by the linear distance taper factor (range 1:0).


Tuesday, February 16, 2010

Irregular updates to GHCN