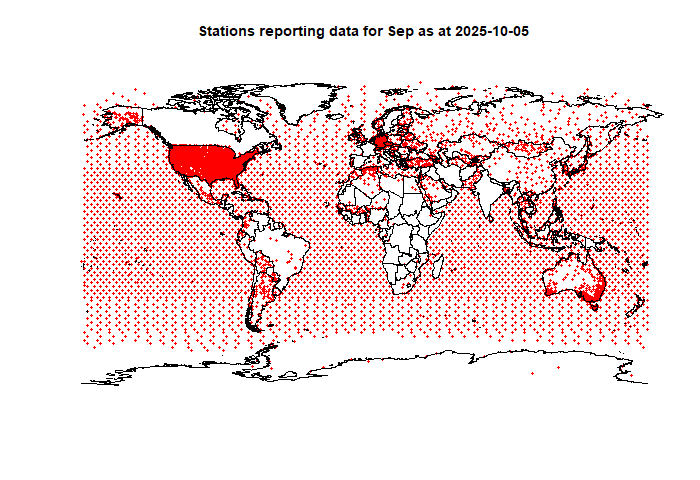
As last month, data from NOAA's GHCN V4 was patchy, missing China among other places. I suppose with the shutdown, we're lucky to have any data at all. So, as last month, I have augmented with JMA data where GHCN is missing. JMA seems to have data from stations that submit CLIMAT forms, which is roughly GHCN V3. With that added, there were 2414 land stations outside US. I would normally hold out for 3200, but there is at least some coverage of most areas except much of Africa. I'll show below a map of stations included.
The
TempLS FEM anomaly (1961-90 base) was 1.04°C in September, up from 0.989°C in August. It was the third warmest September in the record, behind 2023 and 2024.
Here is the temperature map, using the
FEM-based map of anomalies. Use the arrows to see different 2D projections.
As always, the
3D globe map gives better detail. There are more graphs and a station map in the
ongoing report which is updated daily.
And here is the map of stations reporting: