November 2023 at 1.269ºC was the warmest November in the record; after 2024, next was 2015 at 0.927ºC. It looks as if 2024 will break the annual record (2023) by about 0.12ºC.
For about 13 years, I have posted a follow-up to these regular posts, in which I compare the monthly value and map with GISS. They general result is that they match very well, so I have decided to not keep doing that. I think the point is made. So this will be the only TempLS post for the month. All the data for comparison is available at the latest data page.
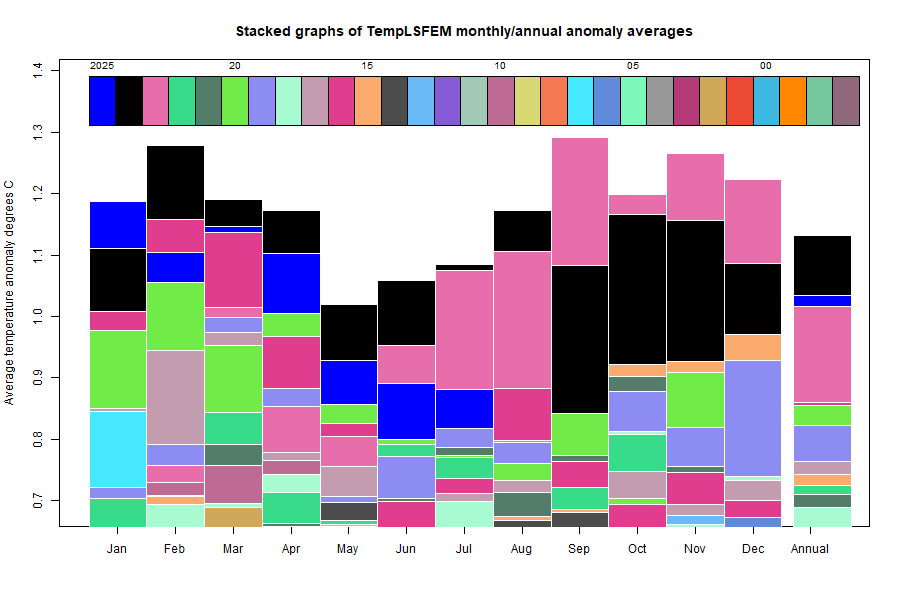
Here is the corresponding stacked graph, showing how much hotter recent months have been:

Here is the temperature map, using the FEM-based map of anomalies. Use the arrows to see different 2D projections.
As always, the 3D globe map gives better detail. There are more graphs and a station map in the ongoing report which is updated daily.


