Jim Hansen's update, with many more details, is here. He thinks that it is clear that 2020 will pass 2016 as hottest year.
As usual here, I will compare the GISS and earlier TempLS plots below the jump.
Here is GISS V4

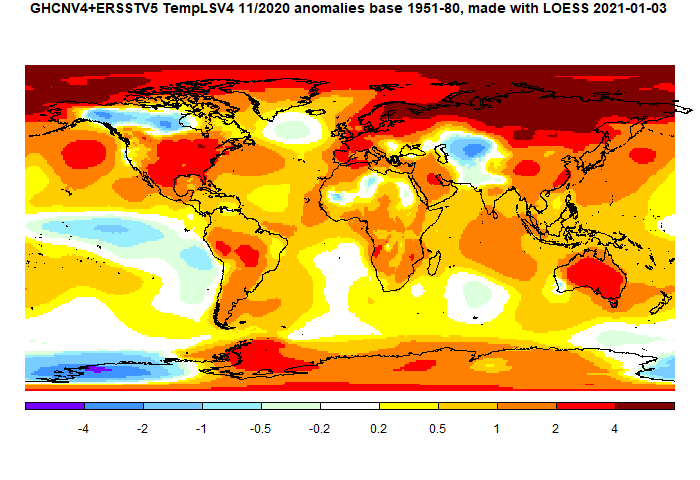
And here is the TempLS V4 LOESS-based plot
This post is part of a series that has now run for seven years. The GISS data completes the month cycle, and is compared with the TempLS result and map. GISS lists its reports here, and I post the monthly averages here.
The TempLS mesh data is reported here, and the recent history of monthly readings is here. Unadjusted GHCN is normally used, but if you click the TempLS button there, it will show data with adjusted, and also with different integration methods. There is an interactive graph using 1981-2010 base period here which you can use to show different periods, or compare with other indices. There is a general guide to TempLS here.
The reporting cycle starts with a report of the daily reanalysis index on about the 4th of the month. The next post is this, the TempLS report, usually about the 8th. Then when the GISS result comes out, usually about the 15th, I discuss it and compare with TempLS. The TempLS graph uses a spherical harmonics to the TempLS mesh residuals; the residuals are displayed more directly using a triangular grid in a better resolved WebGL plot here.
A list of earlier monthly reports of each series in date order is here:


I update my prediction for GISS temperature anomaly using data up to Nov20.
ReplyDeleteGISS.v4
J-D20 1.03+-0.02
DJF21 1.11+-0.21
MAM21 1.02+-0.20
JJA21 0.97+-0.14
SON21 1.05+-0.16
J-D21 1.04+-0.14
Now the prediction gives more than 98% chance of a new record this year, or at least to be equal with 2016. The GISS December anomaly could fall to 0.76 and still breaking the 2016 record in 2020.
Additional it gives a 56% chance of breaking this new record again in 2021.
Note that this may be on the high side because of the La Nina, because it still does not use newer ENSO data yet.
This is the first version not using ENSO data at all. I will switch to a merge of MEI and MEI2 ENSO data, if I find time to do this.
Thank you for posting GISS data and jim hansens comments.
ReplyDeleteinterestingly, he states that: "The rate of global warming accelerated in the past 6-7 years (Fig. 2). The deviation of the 5-year (60 month) running mean from the linear warming rate is large and persistent; it implies an increase in the net climate forcing and Earth’s energy imbalance, which drive global warming."
However, neither NOAAs recent update on OHC including sept 2020 https://www.ncei.noaa.gov/data/oceans/woa/DATA_ANALYSIS/3M_HEAT_CONTENT/GRAPHS/heat_content2000m.png
nor NASAs own data on the steric component of sea level increase suggest any steeper increase (i.e. increased energy imbalance) compared to the overall period after 2002 - as the ARGO data became available. The last 5 years overall NINO-dominance appears as a more likely explanation for the increased trend in surface temperature.
https://sealevel.nasa.gov/understanding-sea-level/key-indicators/steric-height
The last 5 years have been overall ENSO neutral to negative, as shown by detrended NINO3.4. It's true that it's been positive relative to the several years before, so that shift has obviously been a significant factor in the recent sharp uptick, but not in context of the longer term record.
DeleteIt may not be immediately obvious by eyeballing but the NOAA OHC data actually does show clear acceleration if you plot running decadal warming rates. Energy imbalance acceleration is also clear in the CERES-Ebaf TOA data and sea level data, particularly given the apparent deceleration in Greenland mass loss over the past several years.
Acceleration is also just a physical inevitability given continued linear/super-linear rise in GHG forcing plus apparent weaking in negative aerosol forcing following pollution controls in China and other countries.
There can be no doubt that when including the 2015-16 event, the last 5 years have been dominated by Nino, which is also clear from the ONI values.https://origin.cpc.ncep.noaa.gov/products/analysis_monitoring/ensostuff/ONI_v5.php
DeleteAs regards the CERES data, a recent publication suggest there are biases that needs to be corrected, and that infact the trend in earths enegy imbalance and OHC has tipped towards a reduction the last decade. Remote Sens. 2019, 11(6), 663; https://doi.org/10.3390/rs11060663
From the Abstract:
Decadal changes of the Reflected Solar Radiation (RSR) as measured by CERES from 2000 to 2018 are analysed. For both polar regions, changes of the clear-sky RSR correlate well with changes of the Sea Ice Extent. In the Arctic, sea ice is clearly melting, and as a result the earth is becoming darker under clear-sky conditions. However, the correlation between the global all-sky RSR and the polar clear-sky RSR changes is low. Moreover, the RSR and the Outgoing Longwave Radiation (OLR) changes are negatively correlated, so they partly cancel each other. The increase of the OLR is higher then the decrease of the RSR. Also the incoming solar radiation is decreasing. As a result, over the 2000–2018 period the Earth Energy Imbalance (EEI) appears to have a downward trend of −0.16 ± 0.11 W/m2dec. The EEI trend agrees with a trend of the Ocean Heat Content Time Derivative of −0.26 ± 0.06 (1 σ ) W/m2dec."
The paper below concludes that el nino causes weak but robust ocean cooling, makes sense as heat is transferred from ocean to atmosphere and then radiated to space. In-any-case ENSO effects on global temperature peak in statistical analysis with a 3 to 5 month lag, and then fade, good luck finding a signal after 5 years.
Deletehttps://journals.ametsoc.org/view/journals/clim/32/12/jcli-d-18-0607.1.xml?tab_body=fulltext-display
Unknown,
DeleteThere can be no doubt that when including the 2015-16 event, the last 5 years have been dominated by Nino... ONI
ONI is basically the same data I posted except without meaningful detrending. It simply defines all values as difference from a 30-year baseline. Since we know temperatures are trending upwards we know that recent ONI figures will almost always be biased high.
So, yes, there is doubt about El Nino dominance. Using the detrended data it depends on how you define the last 5 years. If you actually mean the last 60 months of data it points to weakly negative ENSO. If you want talk about 5 years as 2015 through 2019 it is weakly positive. If you go from 2015 all the way to present it's weakly negative. And you also get essentially the same answers from the independent MEI and SOI indicators. The truth is the past 5 years have really been ENSO neutral.
a recent publication suggest there are biases that needs to be corrected, and that infact the trend in earths enegy imbalance and OHC has tipped towards a reduction the last decade.
I'm familiar with that paper and it's complete nonsense. All they did was identify a systematic downward trend in RSR and decided, literally based on nothing, that it shouldn't be there. Bizarrely, at no point did they bother to check whether such a systematic RSR trend is expected to occur with climate change (Hint: it is).
I fail to see that detrending the ONI values are more informative as regards de de facto impact Nino and Nina events have on global atmosphere temperature. In the last 5 years we have had one extreme strong nino event, and onle a weak nina (2018) but also a weak nino again (2019). The current moderate Nina is just now beginning to influence global tenperature, and the major effect will be seen in 2021.https://chaac.meteo.plus/en/climate/enso-elnino-lanina-10.png
DeleteAs regards the energy imbalance, you may dislike the results of Dewitte et al, and I may agree that a downwoard trend in energy imbalance may not be justified. However, it is more difficult to ignore the NOAA ocean heat data, which clearly do not how any steeper increase the last 5 years https://www.ncei.noaa.gov/data/oceans/woa/DATA_ANALYSIS/3M_HEAT_CONTENT/GRAPHS/heat_content2000m.png
Several well-known experts describe the energy imbalance as quite unchanged in the last decades, for instance R. P. Allan in his 2017 publication.
http://centaur.reading.ac.uk/74764/1/Allan2017CLIVAR.pdf
"Recent estimates of net radiative imbalance at the top of the atmosphere of 0.6-0.8 Wm-2 for 2005-2015 (Johnson et al., 2016) are primarily determined by ocean heat content changes measured by Argo buoys; this and additional observations and assumptions are applied in anchoring the satellite records (Loeb et al., 2012) which themselves provide excellent representation of interannual variability and
decadal trends. The net imbalance is remarkably stable over time with trends of just 0.02±0.01 Wm-2 per decade over the period 1988-2015, substantially smaller than the expected uncertainty".
Finally, J. Hansen is making a suprising mistake when trying to use a 5 year period in atmospheric temperature trends to say anything about the earths energy imbalance. We all know that the heat contant of the atmosphere is minimal compared to that of the ocean, and if extra heat is released from the ocean to athmosphere in a certain period, there will be a huge atmosphere warming, with corresponding increase in OLR, and the energy imbalance will go in the opposite direction. Best regards, T. Klemsdal, Oslo
Perhaps will catch up in a few years on how to model climate indices
ReplyDeletehttps://geoenergymath.com/2020/12/22/overfittingcross-validation-enso%e2%86%92amo/