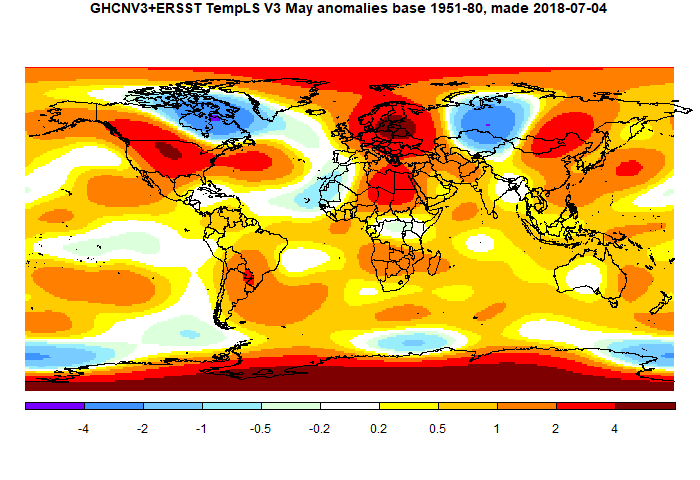
It was very warm in much of N America, except NE Canada (cold), and very warm in Europe. Cold in E Siberia, but warm in East Asia generally. Again a pattern of warm blobs around 40-50 °S, though less marked than in recent months. Quite warm in Antarctica (relatively).
Here is the temperature map. As always, there is a more detailed active sphere map here.
Data from Canada delayed this report by a couple of days. Following my recent post on the timing of data arrival, I kept a note of how the TempLS estimates changed day by day as May data came in. The TempLS report is now first posted when the SST results are available, but I wait until all large countries are in before writing a post about it. Here is the table (Melbourne time):
| Date | Number stations (incl SST) | Temperature | |
| June 05 | 4516 | 0.676 | |
| June 06 | 4829 | 0.723 | |
| June 07 | 5294 | 0.709 | |
| June 08 | 5372 | 0.708 | |
| June 09 | 5381 | 0.709 | |
| June 10 | 5474 | 0.678 |
Canada (late) did have a cooling effect.
Read More
This post is part of a series that has now run for six years. The TempLS mesh data is reported here, and the recent history of monthly readings is here. Unadjusted GHCN is normally used, but if you click the TempLS button there, it will show data with adjusted, and also with different integration methods. There is an interactive graph using 1981-2010 base period here which you can use to show different periods, or compare with other indices. There is a general guide to TempLS here.
The reporting cycle starts with a report of the daily reanalysis index on about the 4th of the month. The next post is this, the TempLS report, usually about the 8th. Then when the GISS result comes out, usually about the 15th, I discuss it and compare with TempLS. The TempLS graph uses a spherical harmonics to the TempLS mesh residuals; the residuals are displayed more directly using a triangular grid in a better resolved WebGL plot here.
A list of earlier monthly reports of each series in date order is here:


A recent article by Folland in Science (DOI:10.1126/sciadv.aao5297) showed that ENSO is the largest factor in global temperature variability.
ReplyDeleteThanks, Web. The paper is here.
DeleteI guess that it will take them at least a couple of years to understand the mechanism behind ENSO. Think it's like an escape room with math involved.
Delete