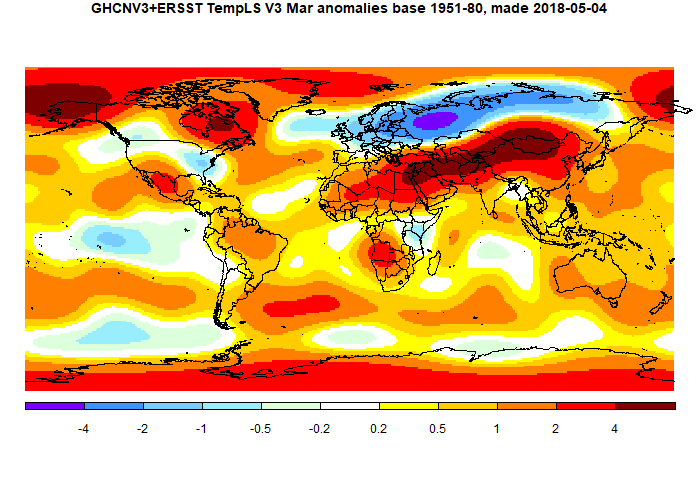
The overall pattern was similar to that in TempLS. A cold band across N Eurasia, and a warm band below across mid-latitudes. Warm in N Canada and Alaska, but cool around the Great Lakes. As with last month, both show an interesting pattern of mostly warm patches in the roaring Forties.
As usual here, I will compare the GISS and previous TempLS plots below the jump.
Here is GISS

And here is the TempLS spherical harmonics plot
This post is part of a series that has now run for six years. The GISS data completes the month cycle, and is compared with the TempLS result and map. GISS lists its reports here, and I post the monthly averages here.
The TempLS mesh data is reported here, and the recent history of monthly readings is here. Unadjusted GHCN is normally used, but if you click the TempLS button there, it will show data with adjusted, and also with different integration methods. There is an interactive graph using 1981-2010 base period here which you can use to show different periods, or compare with other indices. There is a general guide to TempLS here.
The reporting cycle starts with a report of the daily reanalysis index on about the 4th of the month. The next post is this, the TempLS report, usually about the 8th. Then when the GISS result comes out, usually about the 15th, I discuss it and compare with TempLS. The TempLS graph uses a spherical harmonics to the TempLS mesh residuals; the residuals are displayed more directly using a triangular grid in a better resolved WebGL plot here.
A list of earlier monthly reports of each series in date order is here:


Nick, in preparation of anomalous temperatures , are they from Tmax-Tmin 24hr Averages?. Has any work been done using 3hrly blocks for this instead of 24hr blocks? I see here in Australia, there is a 60% bias towards heating in just the 6am-9am block. http://www.bishop-hill.net/blog/2011/11/4/australian-temperatures.html
ReplyDeleteOr is it with satellites, the average is (say 1min) continuous data..
All data here is 24 hr max - min. People fantasize about how it might be done better, but they don't say how we could instantly get a long record measured as they would wish. I think max - min is a quite adequate measure of average temp. I did an analysis here comparing hourly integrated average vs max - min with various observation times, for three years of data at Boulder Colorado. The time of observation certainly made a difference, but the 24-hr average behaved very like a max-min.
DeleteI found that looking for even just 3 years of near-continuous hourly data in recent times was not easy to find.
Actually, GISS uses whatever countries report themselves as mean temperature, whether that's (max+min)/2 or something based on fixed hours. The method used isn't particularly important as long as it's historically consistent within a country.
ReplyDeleteThe study mentioned above has a number of issues, the most significant of which is it fails to take any account of changes in the network over time (before the automatic weather station era, most stations only reported at 9am and 3pm, so the number of stations reporting at 6am has mushroomed in the last couple of decades whilst the number of stations reporting at 9am has stayed fairly stable).
Thanks, Blair
DeleteYes, I stand corrected about all in GISS being min/max was wrong, though I think historically many were. I use GHCN Monthly, where I think TAVG is often worked out as (TMAX+TMIN)/2, where TMAX is the reported average of max. Not always, because sometimes there is a TAVG without the corresponding TMAX. I see the CLIMAT forms ask for T and also Tx and Tn, and often (eg Australia, it seems) T = (Tx+Tn)/2.
Lawrimore et al are rather non-committal; they say:
"[8] Monthly mean temperatures can be calculated as an average of daily observations (e.g., the average of daily maximum and minimum tempe ature) or from daily averages of observations collected at various times during a day. These can include averages of observations taken every hour or an average of observations made at various times during a day (e.g., every three or six hours or at three fixed hours during the day). There are many other ways of calculating monthly mean temperature, and in many cases more than one"
I agree that it doesn't matter much, if consistent over time, and even if not, it is similar to a TOBS change. As mentioned above, I showed the 24 hr average at Boulder Colo compared with synthetic min/max corresponding to various reading times; it fitted in pretty well.
Back in the old days in Sweden, before electronic thermometers, the temperature was read manually at three fixed hours plus max and min. The diurnal average was calculated with the Ekholm-Mode'n formula: Tmean = aT07 + bT13 + cT19 + dTmax + eTmin, with different coefficients depending on month and longitude.
DeleteWith five readings per day, it's no wonder that the method is more precise than averaging max and min only:
https://rmets.onlinelibrary.wiley.com/doi/full/10.1002/joc.3510
As long as the daily average is measured and calculated in a consistent way there is no bias, but if the methods change it will be necessary to homogenise the data.