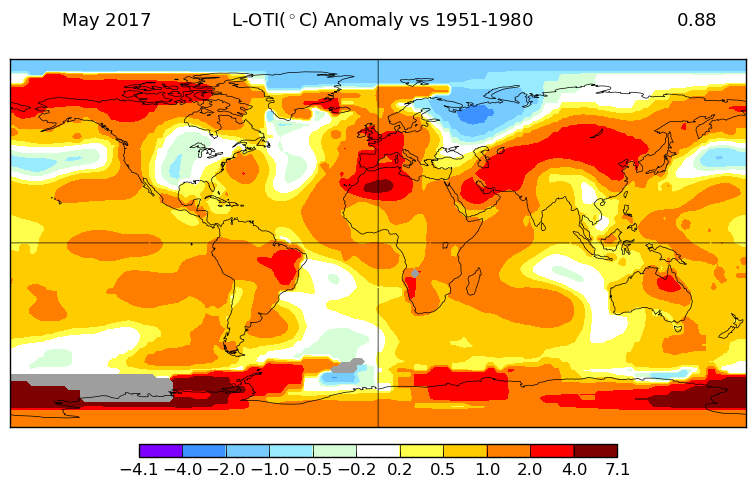
The overall pattern was similar to that in TempLS. A big warm band from N of China to Morocco (hot), with warmth in Europe, and cold in NW Russia. Wark Alaska, coolish Arctic and Antarctica mixed.
As usual, I will compare the GISS and previous TempLS plots below the jump.
Here is GISS

And here is the TempLS spherical harmonics plot


The fact that May isnt warmer than April, like in the reanalyses, seems to be caused by cool SST. In the met station only index, Gistemp dTs, May is 0.11 C warmer than April, and the warmest May ever..
ReplyDelete"June looks like being cooler, which reduces the likelihood of 2017 exceeding 2016 overall."
ReplyDeleteIt was unlikely from the start that 2017 may exceeding 2016. But it may more likely exceeding 2015.
As you said, there may be again, as in the last years, a 'June and July are much colder than average in Antactica' thing. This may depresses the global temperature a bit. If Jun17 is only 0.73 (0.05 colder than last year, as NCEP so far (my forcast would give 0.86+-0.14)), then my forecast goes down from 0.93+0.06 to 0.89+-0.05 for 2017.
ReplyDeleteENSO ONI, last update: +.4; JIASO PDO, May update: .88; AMO, May update: .32... looks like Eastern Pacific may cool... but .89 ℃ is obviously exceptionally warm coming off the 2016 La Niña. Tropical Tidbits shows Niño 3.4 at +.484 for today, so the Eastern Pacific has not yet started cooling, which is what some of the models were predicting for June.
ReplyDeleteFor my past ENSO simulations, I have been inferring the gravitational forcing due to the long-period lunar cycles. I did this by combining monthly/fortnightly/mixed Draconic and Anomalistic factors to achieve a best fit to the ENSO time-series. This is similar to how ocean tidal analysis is performed.
ReplyDeleteBut more recently I found a more direct way to produce the lunar forcing, which is via measures of the length-of-day (LOD) variations. This gives us the equivalent cyclic angular momentum (AM) variations in the earth's rotation resulting from the gravitational ebb and flow. The delta AM then generates the forcing resulting in the sloshing of the ocean's thermocline (and also atmosphere for the wind proponents).
In the figure below, the upper time-series is the modeled ENSO from a fit from 1880-1980, and the bottom is the extrapolated LOD used for the fit scaled against the actual LOD. That is expanded on an out-of-band interval measured from 2000 to 2003.
http://imageshack.com/a/img922/6999/yC88BH.png
No one else is working this angle, which I find mind-blowing considering how much effort is put into modeling orbital variations for paleoclimate studies.