I was surprised by the TempLS result, since the NCEP/NCAR index had indicated a much warmer result. HADSST3 also rose in May. But the GISS result essentially confirms it. It coincides with the new version 3.3 of GHCN, which would have influenced both indices. But that change made little difference to previous months. I am planning to post a study of the anomaly differences between April and May.
TempLS Grid also rose by about 0.05°C, so I think May rises in HADCRUT and NOAA are likely.
Below the fold is the customary comparison between GISS and TempLS.
Here is the GISS map for May:
And here is the corresponding TempLS map, using spherical harmonics:
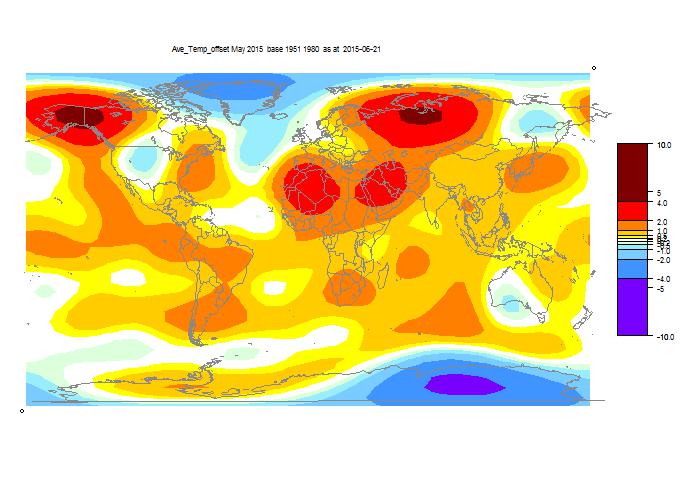


It is possible to make a similar map for the NCEP/NCAR data averaged of May for comparison?
ReplyDeleteIs the difference really in Antarctica as I suppose?
It is difficult to compare that with the daily data here.
http://www.moyhu.blogspot.com.au/p/latest-ice-and-temperature-data.html#webgl
I'll try to add a month average display. I have made a april-may TempLS comparison, which I'll post.
DeleteI've added a hack, which I'll fix properly in the next day or two. Using the date chooser, it is possible to select the 0'th day of the month. For 2015, jan=may, that will show the monthly average. ie if it says 2015-5-0, that is the month average.
DeleteThere are differences, in Antarctica and NE Siberia, where GHCN has very cold readings, and NCEP does not.
Thanks! I can see the differences in Antarctica.
DeleteBy the way, I've found an error in the active plotter for global temperature indices. The UAH6.beta is shifted by one month.
"I've found an error in the active plotter"
DeleteThanks, fixed.
Thanks. The error was fixed some hours ago, but now has suddenly appeared again.
DeleteI'll dig deeper. The error comes because UAH started in December 1978. One month in a year isn't useful, so I omit it, and start in Jan 1979. But something keeps reinstating it, and pushing the months forward. The numbers are recalculated each evening local time.
DeleteHopefully the latest fix will stick. I reran the whole recalc sequence and it seems OK.
DeleteThanks. The error seems now been fixed.
DeleteBut other differences remain.
I have used the active plotter to compare the different temperatures. I found a large difference of the TempLSmesh and TempLSgrid relative to the other land ocean indices (HadCRUT, GISSlo, BESTlo, NOAAlo). The difference is best seen with smoothing, looking on the data from 1990 to 2014. It seems that the TempLSmesh and TempLSgrid are sometimes later by several months than the other land ocean indices, especially from 1997 to 2002. But at other years they agree well. What could be the reason?
Anon,
DeleteI'll check tomorrow. One thing you can do with the active plotter is to use the data button to dump the plot data. Unfortunately, for TempLS this is of limited use, since that is currently the only source of actual numbers on the web. But I can check against the output files.
It looks like the TempLSmesh and TempLSgrid uses before around 2010 the ocean data from 12 months before with the land data from the correct year. So for example for the May 1998 it is ocean data from May 1997 and land data from May 1998, were the ocean 1998 data are used in 1999 and so on.
DeleteThanks, that is a useful observation. ERSST3b came in decade blocks, 2000-2009 etc. I read the old ones and keep them (they are large), and just read the new 2010- file that is updated every month. It is possible that I messed up the changeover. I'll check in the morning. If so, it will all change anyway with v4, which I'll adopt now that NOAA has. That has annual files.
DeleteOk, that explains a lot. I have noticed that warmest month of the 20th century in TempLS is Feb 1999, not Feb 1998 like in all other global datasets.
DeleteAnother observation is that the pronounced spike of 1944 is missing.
Looking forward to TempLS with ERSST v4....
"Another observation is that the pronounced spike of 1944 is missing."
DeleteWhat ? How did that happen?
There is a very strong and broad El Nino spike, but that is centered about 1941.
The WWII anomaly is the most problematic interval of the historic time series.
WHT, try "Climate plotter V2" in the upper right corner, the highest annual value during WW2 is definitly 1944 in all datasets exept TempLS
DeleteThanks, Anon, that pinpointed the problem. When I merge the old ERSST3b files (1860-2009) with the new (2010-) I treated the old as if they were years 1861-2010.
DeleteI'm fixing now, so there may be instability on the latest data page wrt TempLS.
I know. The issue of calibration between civilian and military measurements during WWII has never been sufficiently addressed nor resolved. It is arguably better to leave these interval out of the time series.
DeleteThanks, Anon and everyone. I think it is corrected now, and is much better. I looked at TempLS mesh and grid around 1999, with GISS and NOAAlo. The alignment is very good.
DeleteAny effect on recent values would be by displacement of the anomaly base, but I think there is vary little.
Next month I'll definitely use ERSST v4. Maybe sooner.
Surprising may temps by GISS, I was expecting 0,77 according to NCEP cfsv2 (+0,16°C). May is the most surprising month since july 2014 and the China problem. In april, GISS missed antarctica data and corrected global temp from 0,75 to 0,71. Maybe the problem was still not resolved in may ? You noticed Antarctica was colder in GISS data than in NCEP ?
ReplyDeleteJune seems to be very, very warm, according to NCEP, do you thing that could be equivalent to 0,85 for GISS ?
Yes, it is surprising. GISS and TempLS mesh agree, so I don't think it is a GISS mistake. TempLS Mesh and Grid disagree somewhat, so the difference is sensitive to weighting. That's why I think NOAA and HADCRUT will show a rise. I hope I'll get my difference analysis out soon. There were at least two particularly cold Antarctic stations, and two in E Siberia. They are highly weighted in TempLS mesh, so that may account for part of the difference, but only part.
DeleteJune was warm, but cooling lately. There is still a while to go.
I would predict also a rise for May by regression to time series with existing May values
DeleteHADCRUT 0.70 (0.64 , 0.76)
NOAA 0.55 (0.49 , 0.61)
I see that NOAA did post a big rise. As usual, the time series file comes a few days later than the CAG announcement; I'll write about it then.
DeleteAs we can see in the figure there, NOAA doesn't cover the Arctic or Antarctica.
DeleteNOAA May data are already here
http://www.ncdc.noaa.gov/cag/time-series/global
May 2014 0.79°C
May 2015 0.87°C
But this is relative to 20th century mean, so I add the difference to the May 2014 data here
http://www.moyhu.blogspot.com.au/p/latest-ice-and-temperature-data.html#L1
I get 0.491+ 0.08 = 0.571 consistent with my prediction above.
Not only did NOAA announced record may, it's the whole temperature time series that is changing with ERSST 4. Changes concerning the slowdown since 1998 and a year like 2013 is now warmer.
DeleteOld New
1 2014 0,69 1 2014 0,74
2 2010 0,65 2 2010 0,70
2 2005 0,65 3 2013 0,66
4 1998 0,63 3 2005 0,66
5 2013 0,62 5 2009 0,63
5 2003 0,62 5 1998 0,63
Is NOAA May 2015 the new Karl et al 2015 with ERSSTv4 and ISTI/GHCNv4?
DeleteOr is it GHCN 3.3 and ERSST v4?
Or is it just the new GHCN 3.3?
Quite confusing right now.
Anyway,all gridded datasets show similar record-breaking changes from May 2014; NOAA +0.08, JMA +0.06, TempLSgrid +0.06
From NOAA may : "With this report and data release, the National Centers for Environmental Information is transitioning to improved versions of its global land (GHCN-M version 3.3.0) and ocean (ERSST version 4.0.0) datasets".
DeleteSo it is the same as Karl et al for SST (ERSSTv4) but not for land. That would mean new data from arctic, featuting in Karl, is not in may release.
well to be exact, it's the temperature anomaly that's the same.
ReplyDeleteMaybe you think Hadcrut will show a rise because of lack of coverage in antarctica and incredible SST ? Last month Hadcrut didn't rise as much, even though hadsst3 were already very high.
ReplyDeleteYou also noticed a cooling trend last days of june after a very strong warming, is it due to antarctica cooling ? Forecasts by NCEP GFS show exceptionnal cooling in the next days.
And I would say also NOAA will probably show warmer temps than GISS because cold regions correspond exactly to those not infilled by NOAA, if I get it right ? So may temps by NASA would have been relatively "cold" due to interpolation method wich brought data other datasets don't use ?
ReplyDeleteI've posted my analysis here. I think the main difference is in E Siberia, which may also have less coverage, although not as extreme as further north.
Delete