The TempLS analysis, based on GHCNV3 land temperatures and the ERSST sea temps, showed a monthly average of 0.53°C for September, up from 0.49 °C in August. Last month also showed a higher rise with late data. There are more details at the latest temperature data page.
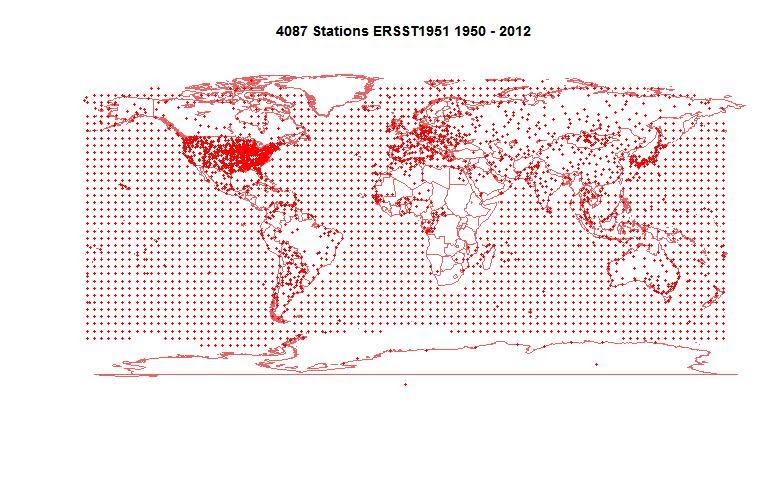
Below is the graph (lat/lon) of temperature distribution for September. I've also included a count and map of the stations that have reported to this date.
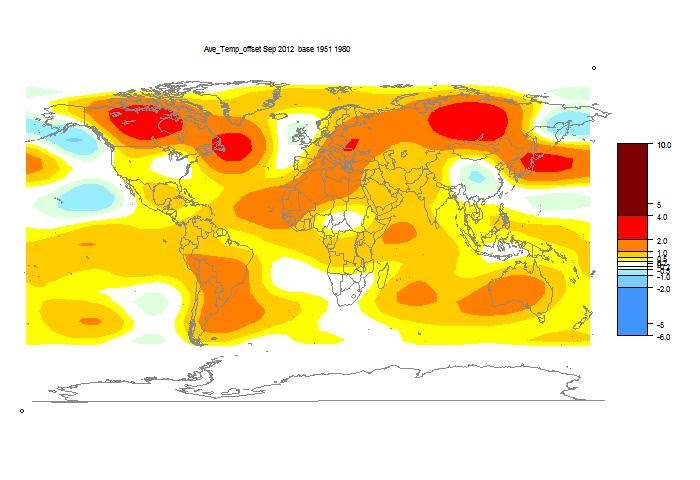
This spherical harmonics plot is done with the GISS colors and temperature intervals, and as usual I'll post a comparison when GISS comes out.
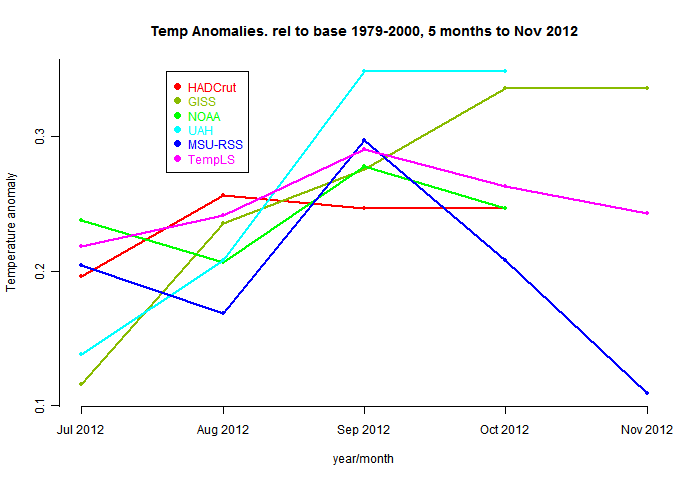
And here, from the data page, is the plot of the major indices for the last four months:
Here is the map of 4087 "stations" which contributed to this report.


0 comments:
Post a Comment