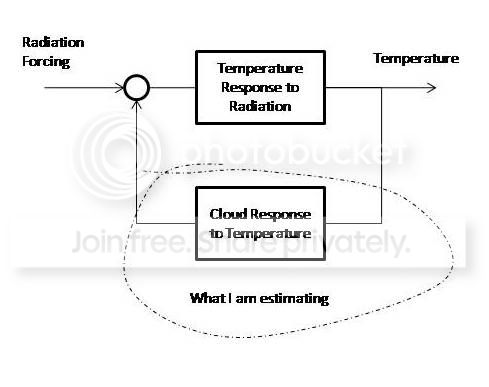
In one of his recent comments Bart posted this diagram of the system he was modelling:

It's a standard feedback system - just two boxes. But to me it raises this query - how can you isolate the box that you want? Electrically, if you look at input-output of box T2, you can't avoid the fact that T1 is in parallel with it. So you's disconnect the box and do the impulse response or whatever out of circuit. It seems to me that weve been trying to do that analysis in circuit, and getting tripped up with causality issues.


Catching up on this topic.
ReplyDeleteIt seems to me that you are making a DC argument while Bart is making an AC (or at least impulse) argument.
In DC signaling you are correct - the signals cannot be separated. But in AC signaling the signals might be separated based on phase displacement in the V and I signals.
JMV,
ReplyDeleteThat's an interesting point - because Bart's model seems to have only one variable - input T vs output CFR, as opposed to the normal two-port V/I at each port. So there's nothing to measure phase displacement against.
But in any case, the period of observation is so short that phase would be hard to pin down.
I am curious how one would properly move to a circuit analogy. You do really need something like, V & I multiplying to give power. Temp and heat flux works, but it's hard to couple them - and heat flux comes in different forms.
Nick,
ReplyDeleteI was pondering the V/I analogy last night. To my knowledge there is no parallel in light. It does seem that there are still several ways to discriminate between the input and the feedback. If the freq is fairly constant then a phase shift can be measured. This was the principle behind phase-shift keying that modems used long ago.
Also a shift in frequency could possibly be used. that seems to be one of the main ways of discriminating between back radiation and DSR.
These would seem to occur in much shorter time frames than Bart is discussing though.
JMV,
ReplyDeleteI'm not sure what aspect of light you are thinking of, but if it gets back to Maxwell's equations, then it's B and E, which has aspects of I/V.
I think it's true that all oscillations involve an interchange between two forms of energy.
B,E and light is a total red herring here. We are looking at the overall dynamic system
ReplyDeleteIn relation to Nick's diag. several points:
1. avoid labelling things like "cloud" there are many things grouped in what Spencer calls radiative and non-radiative. Precise attribution to one effect causes as Dessler does confusion and misinterpretation.
2. we are not trying to disconnect the boxes. We need to total system response. Some people are trying to ignore one of the boxes by saying it is small (Dr.D)
3. you need to add a voltage source. There is a long term, non random input from ocean currents. This is one point where I agree with Dessler.
4. I think the key to distinguishing the two is to note that one is f(dT) the other is g(dT/dt) : radiation causes a rate of change of temperature, not a temperature change.
Most people seems to be missing this last point.
P.Solar
It's Bart's diagram, not mine.
ReplyDeleteTo get the total system response, you'd like to know the characteristics of each box. If they were elec, you'd disconnect and measure. In the atmosphere you can't do that. So in analysing, you need to realise that you are seeing the total system response, and should be careful about attribution accordingly.
Dessler is well aware of the problem. He said in his 2010 paper:
"For the problem of long-term climate change, what we really want to determine is the cloud feedback in response to long-term climate change. Unfortunately, it may be decades before a direct measurement is possible. In the meantime, observing shorter-term climate variations and comparing those observations to climate models may be the best we can do. This is what I have done in this paper."