The TempLS analysis, based on GHCNV3 land temperatures and the ERSST sea temps, showed a monthly average of 0.53°C for September, up from 0.49 °C in August. Last month also showed a higher rise with late data. There are more details at the latest temperature data page.
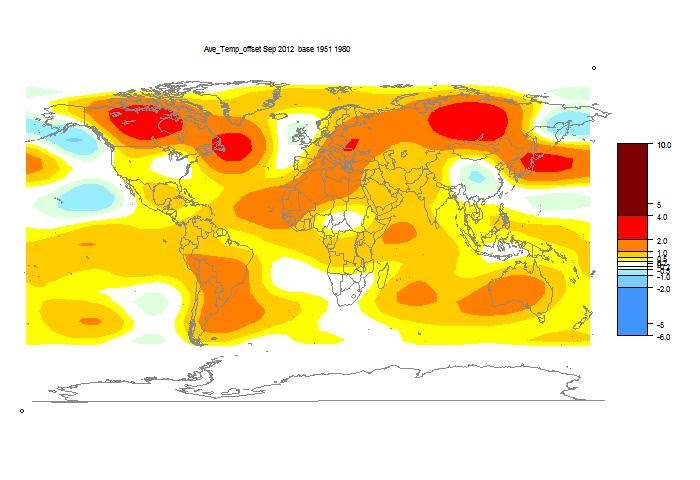
Below is the graph (lat/lon) of temperature distribution for September. I've also included a count and map of the stations that have reported to this date.

This spherical harmonics plot is done with the GISS colors and temperature intervals, and as usual I'll post a comparison when GISS comes out.
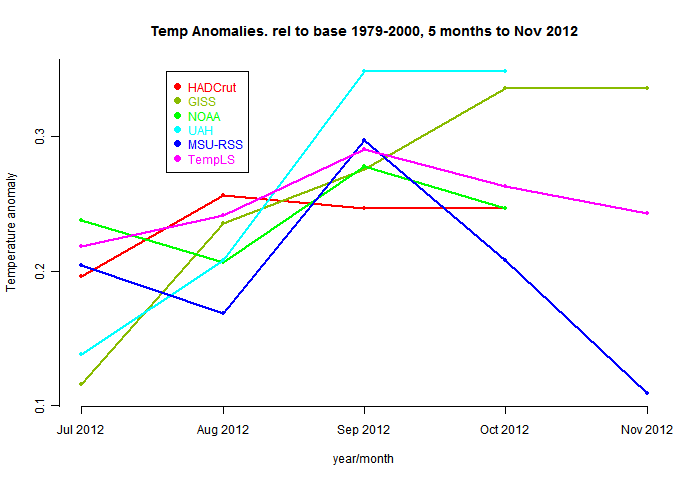
And here, from the data page, is the plot of the major indices for the last four months:

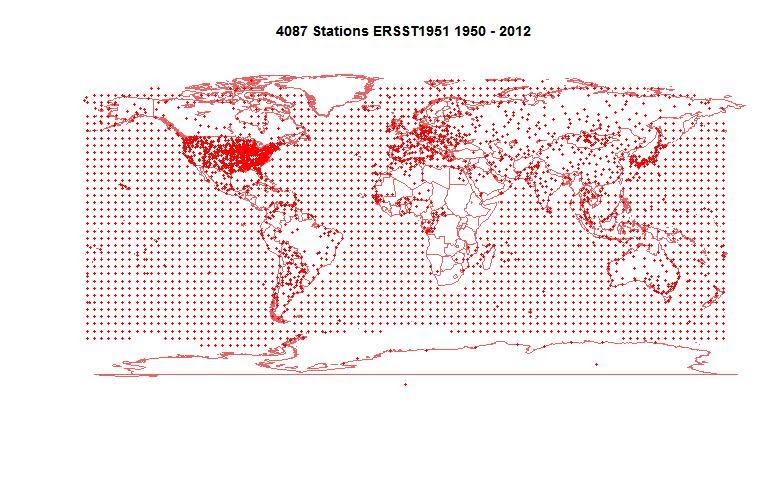
Here is the map of 4087 "stations" which contributed to this report.


Nick, looks like you have the adjusted UAH!
ReplyDeleteYes, the script always reads from the current file, including all past history.
DeleteJust in passing ... soon there should be many more stations on the land side, both historically and in near real time. The databank holding has just gone beta for three months and critical constructive input is welcome before lock-down. See http://surfacetemperatures.blogspot.com/2012/10/beta-release-of-first-version-of-global.html and other posts there as well as http://www.surfacetemperatures.org/databank/. Once the databank is version pointed the next aim is getting new / updated datasets up and running from it.
ReplyDeleteThanks, Peter,
DeleteThat looks fascinating, and really important progress. About 20000 stations currently reporting, including GHCN daily. I'll try to set up an analysis for that as soon as possible.