This month, the cause of that difference is clear, as is the relative coolness of June in GISS. With TempLS reports, I post a breakdown of the regional contributions. These are actual contributions, not just average temperature. So in the following:

you see that the total dropped by about 0.12°C, while Antarctica dropped from conributing 0.07C to -0.07C, a difference that slightly exceeded the global total drop of 0.12C.
That doesn't mean that, but for Antarctica, there would have been no cooling. May had been held up by the relative Antarctic warmth. But it is a further illustration of the difference between the interpolative procedures of GISS and TempLS and the cruder grid-based processes of NOAA and TempLS grid. I would probably have abandoned TempLS grid, or at least replaced it with a more interpolative version (post coming soon), if it were not for the correspondence with NOAA and HADCRUT.
Update: I see that the paper for ERSST V5 has just been published in J Climate. I'll post about that very soon, and also, maybe separately, give an analysis of its effect in TempLS. I see also that NOAA was still using V4 for June; I assume they will use V5 for July, as I expect I will. The NOAA ERSST V5 page is here.
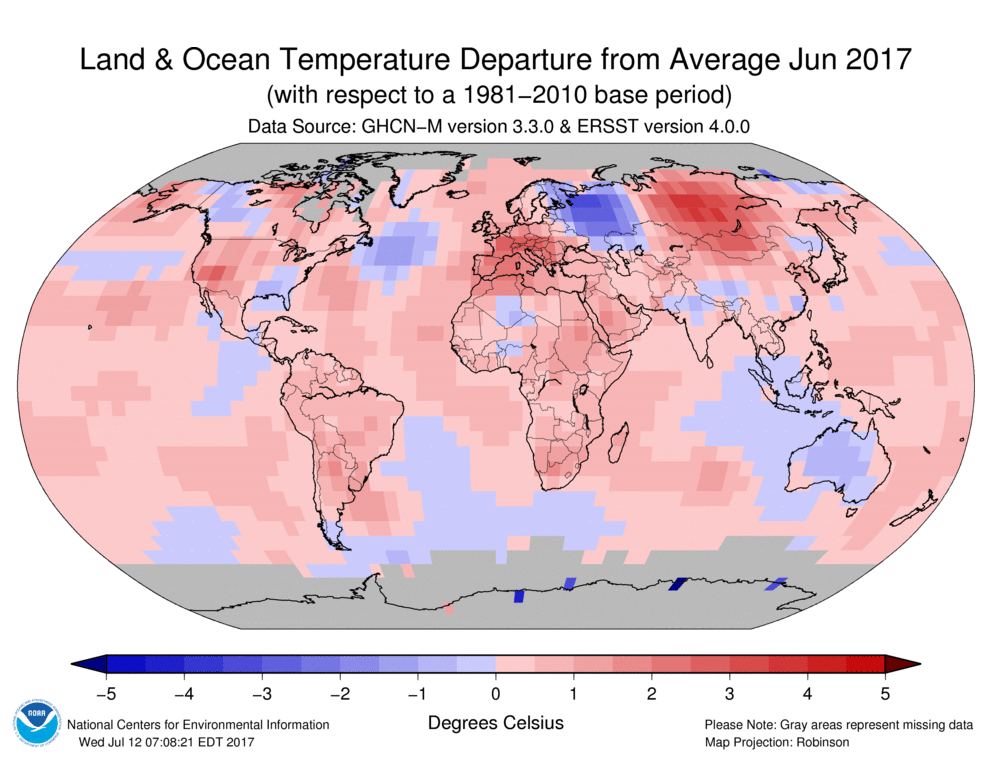
Here is the NOAA map for the month. You can see how the poles are missing.


Compared to June 2016 the drop in NOAA and GISS is exactly the same, 0.10 C. I also noticed that Gistemp dTs had dropped hugely (0.42 C) from May, but compared to June 2016 the drop was only 0.15 C.
ReplyDeleteThe drop from June 2016 is between 0.07 and 0.15 C in all global datasets, with one exception, the Weatherbell reanalysis that drops by only 0.009 C
Comparing same months only has definitely some merits when comparing between datasets..
Olaf, I double-checked the WxBELL GMSTA estimates for May and June and found 0.394 C and 0.259 C respectively and likewise the UM CCI CFSR estimates were 0.39 C and 0.26 C respectively, both with reference to 1981-2010. Thus both CFSR estimates were down by 0.13 C, more in line with TempLS mesh, as might be expected because of better polar coverage. Karsten Haustein's GISS-adjusted GFS estimates were 0.501 C and 0.336 C respectively (also 1981-2010 reference) down by 0.16 C, a bit more in line with the GISS May to June drop of 0.19 C from 0.45 C to 0.26 C (referenced to 1981-2010 for comparison).
DeleteI noticed the new ERA has hourly output. It would be interesting to see near-real-time global, zonal, and regional temperature anomaly estimates on an hourly basis ... some day. Karsten shows this information for every 6-hours from the GFS. I have only seen annual and monthly estimates for ERA so far, not even daily (as with GFS/CFSR) and certainly not in near-real-time.
I know Nick disagrees, but I still believe the global forecast system (GFS and/or ERA) type approach for estimating the GMST and GMSTA is the way of the future (and also for zonal and regional estimates). It is more robust than temperature only, has better spatial coverage, and has the advantage that any procedural changes that are made must be demonstrated to improve the forecast model performance.
I don't really disagree with that. My only issue is with homogeneity, which affects trends etc from a long record. And that problem will fade in the future, as good digital instrumentation becomes more established.
DeleteOK Nick, glad to hear that. I'm still hoping for a global climate reference network, but I'm afraid it won't be happening any time soon.
Delete"I noticed the new ERA has hourly output. It would be interesting to see near-real-time global, zonal, and regional temperature anomaly estimates on an hourly basis ... some day."
ReplyDeleteThat will be great. It will likely expose the lunar tidal forcing on a finer scale than is observed in the ENSO signal. Just a matter of time before climate science catches up to JPL and SYRTE and the other geophysics labs.
Have you considered modifying TempLS to handle sea level?
ReplyDeleteStart with Sydney harbor SeaLevelHeight readings. Interesting biennial signal mixing with ENSO that explains most if not all natural variability
Deletehttp://contextearth.com/2017/05/10/enso-and-tidal-slh-a-biennial-connection/
Start with Sydney harbor SeaLevelHeight readings. Interesting biennial signal mixing with ENSO that explains most if not all natural variability
Deletehttp://contextearth.com/2017/05/10/enso-and-tidal-slh-a-biennial-connection/