In my previous post, I described an article at WUWT called
A simple demonstration of chaos and unreliability of computer models. It claimed issues about solving a simple differential equation which cast general doubt on the reliability of models, but in fact was using iterations far to large to say anything sensible about the DE.
But the recurrence does, for large parameter, generate a chaotic sequence which has useful analogies to waether, climate and their emulation. Here is a plot of part of that sequence. The green, red and blue points are initially separated by a distance of 0.0001 K. The recurrence starts at T
0=300K, and follows the sequence
T
n+1=T
n+b*(1-(T
n/Te)
4) Te=243K, b=170
I follow three sequences, red starting at T
0=300K (red), with green and blue separated there from red by 0.0001 K.
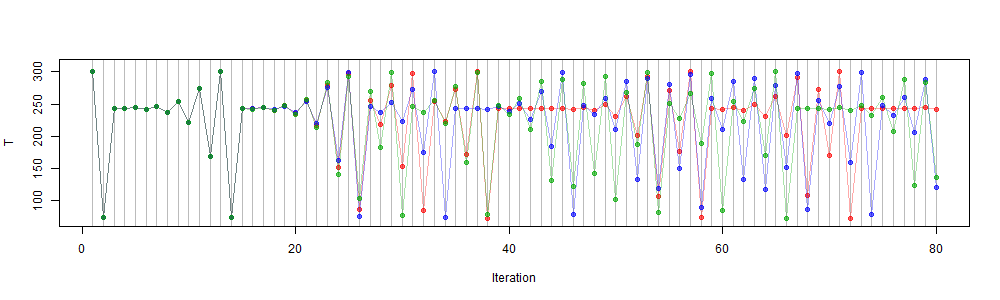
They are initially indistinguishable, but start to separate after about 25 iterations, and although they then sometimes come together, after about 50 timeteps there is really no association between them. You can't usefully predict where any starting point will lead to at that time, because the differences in those initial values are unlikely to be measurable. In fact, as I indicated in the last post, the growth in separation is initially exponential, so the slightest difference in floating value, say 1e-12, will lead to separation delayed by only another thirty or so iterations. I'll give much more detail about this process below.
Weather forecasting is similar. An initial state can be measured with finite accuracy, but small discrepancies grow, so the calculated forecast is useful for only about ten days at most. There is every reason to believe that the Earth itself has a corresponding magnification of small changes. So a perfect emulator could still not predict.
However, some things can be said. The plot remains within finite bounds, the same for each color. You can see that there are patterns whereby sequences of temperature around T
0 are frequent. I will show histograms of frequency of temperatures, which are strongly patterned, and the same for each trajectory. These are the "climate", which is what can be determined in the presence of chaos. And they apply independent of starting points. Finding them is a boundary value problem, not an initial value problem.
I will also show that the climate is quite dependent on the parameter b, and that its dependence can be reliably determined from solution sequences, analogous to GCM runs.


