It is also the same as the 0.04°C drop in the NCEP/NCAR average. Early in August, I said
"NCEP July was fairly close to April, so those are a reasonable guess for July - ie GISS 0.74°C, NOAA 0.78°C. But I wouldn't be surprised to see them a little higher."
Meanwhile GISS June was adjusted down by 0.01.
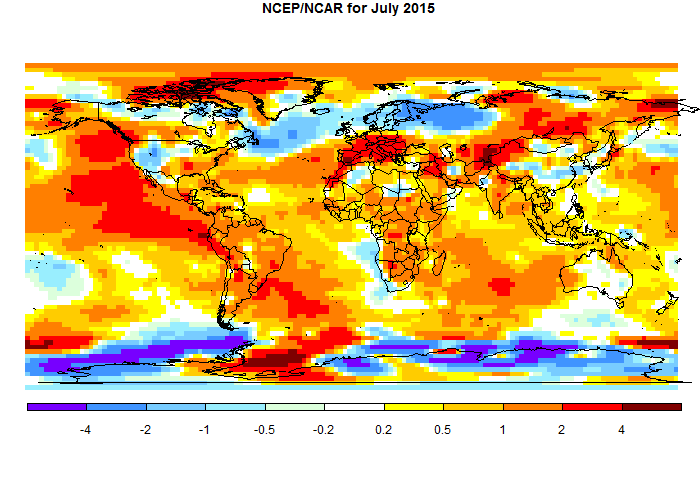
The spatial pattern is quite similar to that of TempLS and the NCEP/NCAR based average. Maps below the fold.
Here is GISS for July:

And here is TempLS mesh (spherical harmonics, so smoothed):

And here is NCEP/NCAR:

For the last, the pattern is similar but redder. That mainly reflects the use of GISS data to bridge the anomaly base gap between the range of good NCEP/NCAR data and 1951-80.


0 comments:
Post a Comment