The TempLS analysis, based on GHCNV3 land temperatures and the ERSST sea temps, showed a monthly average of 0.47°C for July, down from 0.5 °C in June. This was a similar change to the previous month. There are more details at the latest temperature data page.
Below is the graph (lat/lon) of temperature distribution for July. I've also included a global interactive map of station temperatures. There has been publicity about NOAA's declaration of July as a record hot month for the contiguous USA - you can magnify to see the GHCN station readings there.

This spherical harmonics plot is done with the GISS colors and temperature intervals, and as usual I'll post a comparison when GISS comes out.
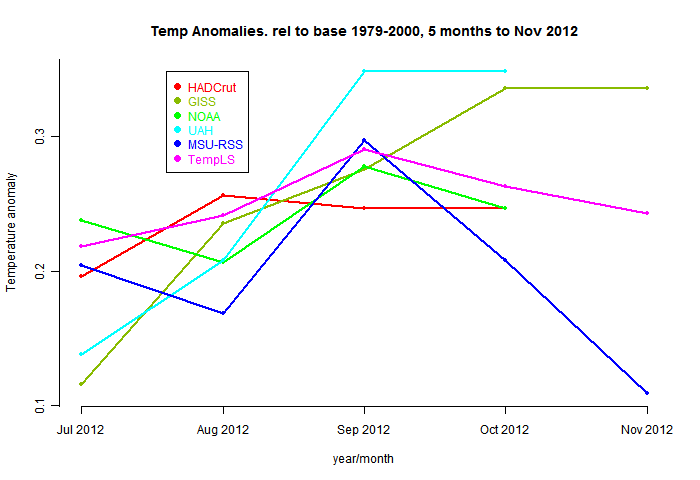
And here, from the data page, is the plot of the major indices for the last five months:
Next is the interactive plot, with some brief usage guidance below.

|
How it works
The flat map at top right is your navigator. If you click a point in that, the sphere will rotate so that point appears in the centre. The buttons below allow modification. Set what you want, and press refresh. You can show stations, and the mesh, and magnify 2×, 4×, or 8× (by setting both). You can click again to unset (and press refresh).Then you can click in the sphere. At the bottom on the right, the nearest station name and anomaly will appear. You may want to have stations displayed here. You'll see two faint numbers next to "stations". This indicates how much your clicked missed the station by (in pixels). It's not really a test of your mousing, but of my getting the alignment right (fiddly).


0 comments:
Post a Comment