I wrote here about the somewhat related "Temperature drives CO2" meme. And I wrote here a few days ago about a weird revival, involving a total misreading by blogger Hockey Schtick of a recent paper on local CO2 perturbations, and the vanishing of that thread.
Vanishing is a relative term nowadays, and sure enough, the story reappeared at WUWT as if nothing had happened. Various oddities ensued; HS turned up to say that his thread hadn't been canned; it was only resting. And the original author, Denica Bozhinova, turned up to say some of the things that had been disappeared at HS. Her paper had been grossly misinterpreted.
Anyway, the usual folk continued as if nothing had happened, with the usual story that natural fluxes greatly outweighed human. I responded thus. But the most direct refutation is the simple graph of mass changes over the years. This is too rarely seen, though there is a good article and plot at SkS, which I cited.
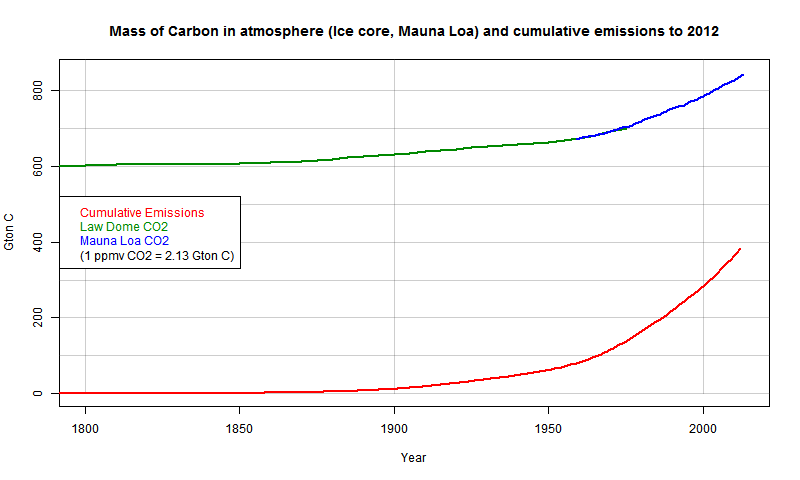
So I did my own. Emissions data (including cement making) is from CDIAC, including BP estimates for 2011 and 2012 (no 2013 yet). CO2 ice core data from Law Dome (Dethridge, via CDIAC), and recent from Mauna Loa Scripps, using annual averages. I converted ppmv to Gt C using the factor 1 ppm CO2 = 2.13 Gton C. I found the following units conversion table useful:
| Gtons C | Gtons CO2 | ppmv CO2 | |
| 1 Gton C= | 1 | 3.666 | 0.433 |
| 1 Gton CO2= | 0.272 | 1 | 0.128 |
| 1 ppmv CO2= | 2.13 | 7.81 | 1 |
Here is the plot:
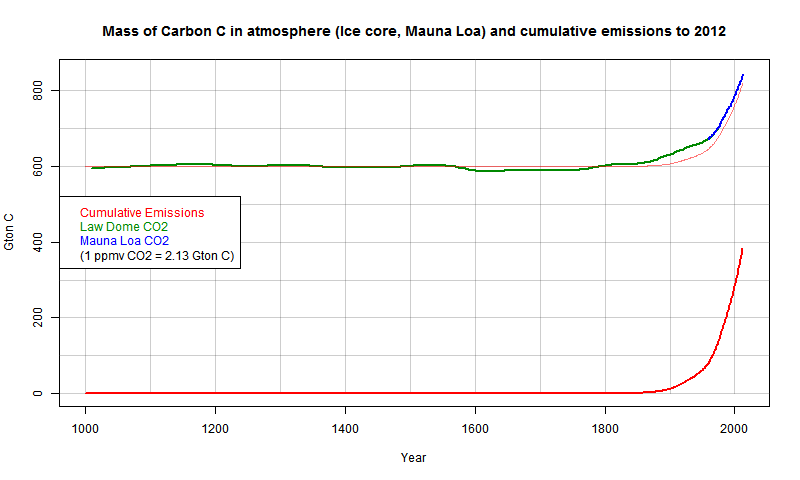
Update - I've added a pale red echo of the emissions curve, displaced to match pre-industrial, and multiplied by the factor 0.57 used by Scripps (see below) to account for airborne fraction. You'll see that the air CO2 starts to rise a little earlier. This is likely the effect of land clearances.
It must be really hard to sell the story that the CO2 response is just natural variation, nothing to do with what we emitted. I'll show more plots below the jump.
Here's a plot just since 1800, for better resolution
And here is the SkS plot (units Gton CO2):

Here is a plot from Scripps Details here:

It shows how the curves superimpose with a constant airborne fraction factor. Smooth version here.


