I have been complaining of erratic posting by GHCN, but this month was fairly smooth, and there are now over 3000 statins outside USA.
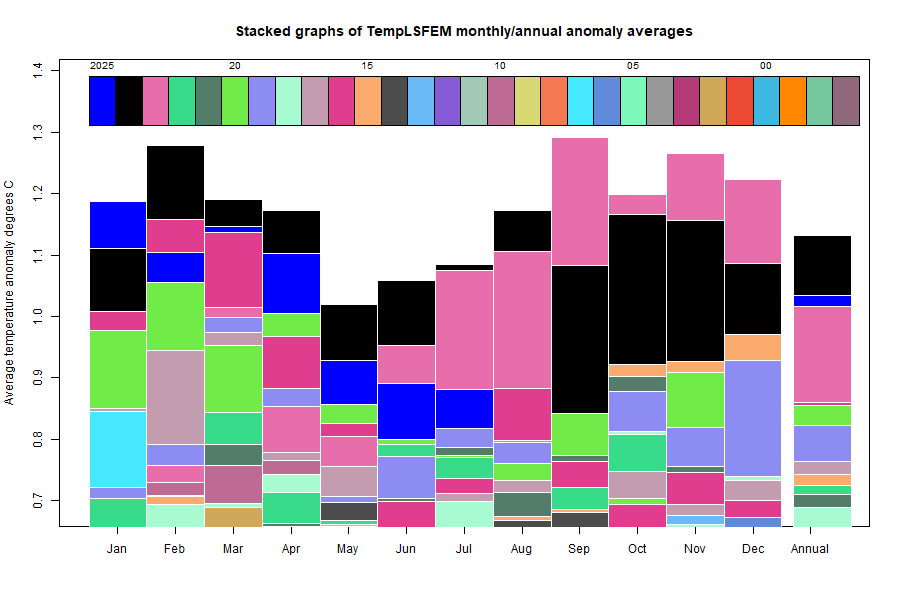
Here is the corresponding stacked graph:
Here is the temperature map, using the FEM-based map of anomalies. Use the arrows to see different 2D projections.
As always, the 3D globe map gives better detail. There are more graphs and a station map in the ongoing report which is updated daily.