It is a bumpy ride with GHCN V4 lately. The file posted on May 30 was empty, and then nothing postd until June 4. At first there were few stations outside USA, but then there was a big jump to over 3000, high by recent standards.
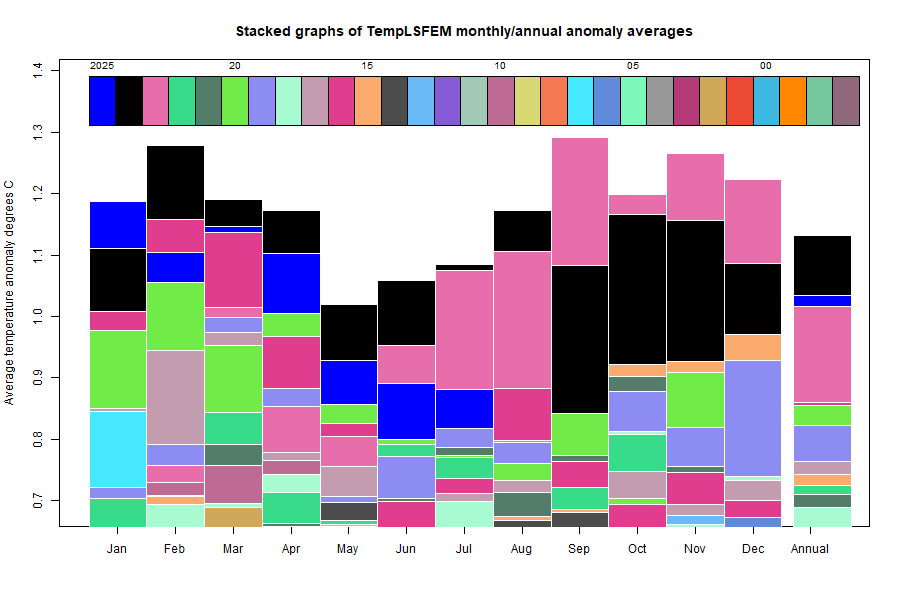
Here is the corresponding stacked graph:
Here is the temperature map, using the FEM-based map of anomalies. Use the arrows to see different 2D projections.
As always, the 3D globe map gives better detail. There are more graphs and a station map in the ongoing report which is updated daily.