
They are so close that the differences are hard to see. It is easier with a 12-month running mean, mainly because the y-axis doesn't have to cover such a large range:
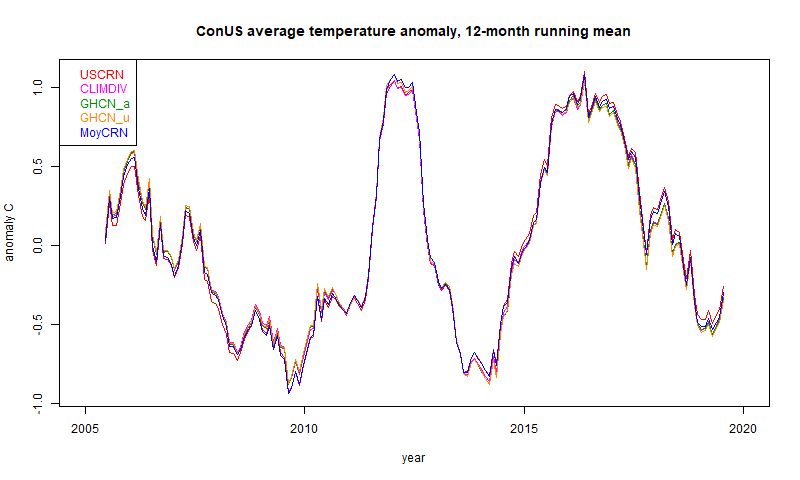
You can see that they are still very close, with some small difference between CRN and the other data. I can quantify this with a table of standard deviation of differences (unsmoothed data):
| 2005-2019 | USCRN | CLIMDIV | GHCN_a | GHCN_u | MoyCRN |
| USCRN | 0 | 0.091 | 0.098 | 0.103 | 0.058 |
| CLIMDIV | 0.091 | 0 | 0.027 | 0.029 | 0.092 |
| GHCN_a | 0.098 | 0.027 | 0 | 0.01 | 0.096 |
| GHCN_u | 0.103 | 0.029 | 0.01 | 0 | 0.099 |
| MoyCRN | 0.058 | 0.092 | 0.096 | 0.099 | 0 |
| Trend | 3.103 | 1.957 | 1.958 | 1.76 | 2.616 |
The very close results are between GHCN adjusted and unadjusted. Here the stations and the methods are the same, so the only difference is the adjustment of the data. And it is very small. The difference between the GHCNs and NOAA's ClimDiv is larger, but still very small.
The two CRNs show a larger difference again, but the largest is between the CRN groups and the others. As I said in the last post, I don't think this reflects different accuracy of the stations; CRN are presumably better. It reflects the dominance of location uncertainty in the spatial averages. That is, how much spread would you see if you measured at different places. Or, how well do you real think the infilling represents the unmeasured regions. Of course, the different coverage gives a check; I showed in the last post a difference plot in one month between the sparse CRN and the dense ClimDiv.
I have also shown the trends, in °C/century. These are very uncertain on such a short period, and you might be surprised at their size, since the plot doesn't reflect that by eye. But a trend of 2 °C/Cen rises only 0.3°C in this period. The closeness reflects that shown in the sd table. I don't think much should be made of the fact that CRN shows a higher trend.
Over a longer period, the CRN results do not cover, and the other data diverge more. The different adjustment policies start to show. Here is the period since 1900. I'm now using a 5 year running mean to make the differences clearer:

Now there is an obvious difference between the adjusted and unadjusted. My GHCN_a still agrees quite well with ClimDiv. Again the differences can be quantified in the reduced table of standard deviations:
| 1900-2019 | CLIMDIV | GHCN_a | GHCN_u |
| CLIMDIV | 0 | 0.064 | 0.257 |
| GHCN_a | 0.064 | 0 | 0.23 |
| GHCN_u | 0.257 | 0.23 | 0 |
| Trend | 0.84 | 0.828 | 0.371 |
The trends (in °C/Cen) again tell the story. Adjustment makes a big difference, as was noted back in USHCN V1. USHCN did both homogenisation and explicit TOBS adjustment, and I believe ClimDiv, which replaced it, does the same. GHCN relies on the pairwise homogenisation to cover the TOBS effect, and on this accounting it seems to do that very well.
Of course, some would say that this means that more than half the (modest) ConUS warming is created by adjustments. The proper scientific view is that unadjusted readings had a spurious cooling bias, which should be corrected. The sources of this are real and known:
- TOBS - it makes a substantial difference whether daily reading of a a min-max thermometer is done in the afternoon, where it tends to double-count warm days, or in the morning, where it double counts cool minima. The times of reading are known, and the pettern is a shift toward morning reading. This is a quantifiable cooling bias, and must be adjusted for. It isn't optional.
- Measurement changes - firstly improved screening, and then MMTS, both produced lower readings. These can be identified as abrupt changes relative to neighbours, and again must be corrected.
https://journals.ametsoc.org/doi/full/10.1175/JAMC-D-13-0248.1
ReplyDeleteJust for reference, you are correct abt climdiv
"GHCN-Daily temperature records do not contain adjustments for historical changes in observing practice. Consequently, bias adjustments were computed specifically for version 2 to account for changes in observation time, station location, temperature instrumentation, and siting conditions. The first step in this process entailed using the method of Karl et al. (1986) to address documented changes in observation time at COOP stations and to adjust the records to a midnight local standard time (LST) observation schedule (matching ASOS, RAWS, and SNOTEL). COOP station histories were obtained from the NCDC Historical Observing Metadata Repository (HOMR) and the U.S. Historical Climatology Network (HCN; Menne et al. 2009). The second step in the adjustment process involved using the “pairwise” method of Menne and Williams (2009) to address all other documented and undocumented changes at any station in any network. For example, the pairwise approach was applied to account for documented changes in station location and temperature instrumentation at COOP and ASOS stations, again using HOMR and HCN for station history information. Likewise, the pairwise approach was used to address undocumented changes in observation time, station location, and temperature instrumentation across all networks, including COOP and ASOS. Because the pairwise method largely accounts for local, unrepresentative trends that arise from changes in siting conditions (Menne et al. 2010; Hausfather et al. 2013), version 2 contains no separate adjustment in that regard."
Thanks, Steven
DeleteHi Nick,
ReplyDeleteThanks for sending me to your web site. I'm enjoying reading what you've done, it helps me a lot.
I'm very confused about what is actually done to the data in GHCN-D and GHCN-M and I strongly suspect the historical data is not consistent from beginning to end. It seems the later data in GHCN-Daily has very few corrections applied, is that true of the earlier data as well? GHCN-M takes its data from GHCN-D now, but the older GHCN-M data is from multiple sources. GHCN-M is homogenized, presumably with PHA, but GHCN-D is not. No mention of TOB corrections. Were they done to earlier data, then they stopped doing them? Or were they removed from of the older data? The documentation is pretty bad and often inconsistent. My interpretation of the inconsistency is that the settled older data, along with whatever was done to it, is left alone. The newer data follows the procedures they now have on their web site. Is that your understanding? What a mess.
Hi Andy (I presume)
DeleteFirst, sorry that I've had to put moderation on the older posts. I am beset by a very persistent spammer. But I'll watch out for your comments.
As you mentioned here GHCN-M comes with two current files - QCU and QCF. QCU are unadjusted (by GHCN). They may have been adjusted at source, but that is rare, since the source is usually a met office just recording what was observed. US data would be unadjusted. qcf is adjusted by the pairwise algorithm PHA. That doesn't include an explicit TOBS adjustment, but relies on PHA to pick up changes.
GHCN-M was originally mostly derived from a project ISTI. GHCN-D was a somewhat separate development. Not all known monthly records have corresponding reliable daily data. I think for new data the two are integrated, and I'm sure all GHCN-D records that are good enough are included in GHCN-M.
"Is that your understanding? What a mess."
No, it isn't a mess. The primary data is the unadjusted, which would correspond to USHCN raw in that dataset. Everything GHCN does works from that, so there is no TOBS to be undone. They record the unadjusted (which doesn't change) in QCU, and put into QCF the current PHA calculation of the adjustments, going right back through the record (same algorithm for all years). That is why you read complaints about adjusted records changing.
In fact GHCN is fussy about not changing QCU. The original V1 was distributed on DVD, and you can check that numbers still haven't changed. They won't even change numbers that are obviously wrong; there are some Bolivian months that show about 80°C, obviously a decimal point dropped. They flag it, but don't make the obvious change. They will only change if there is a change at source.
Yes, this is Andy, sorry I didn't realize I could change my name in the reply box. Thanks for the quick response. It does appear that at some point they started drawing data from GHCN-D, do you know when that happened? The earlier GHCN-M record is almost identical to USCHN. I need to check and see just how close they are. maybe, I can pick a time where they begin to diverge. I sure would like to see a history of what was done and when. The documentation I've been able to find is confusing and often contradictory. My working assumption is the contradictions are because different portions of the record are done differently. But, maybe you are correct, maybe they redid all the old data from scratch. I need to dig deeper.
DeleteDo you know if the nClimGrid data is available in NetCDF? Or is it just ascii?
ReplyDeleteAndy,
DeleteThe source data directory is here. They use the GHCN Daily station set; they don't seem to make a separate file for that. I know only of the ascii data in that directory for divisions. I haven't dealt with that divisional data.