The prominent feature was a huge band of warmth stretching from Europe through to E Siberia and China. N America was also warm, except for Alaska (cold). Greenland and the Arctic archipelago were also cool. Africa was rather cool, Antarctica mixed.
Here is the temperature map, using the LOESS-based map of anomalies.
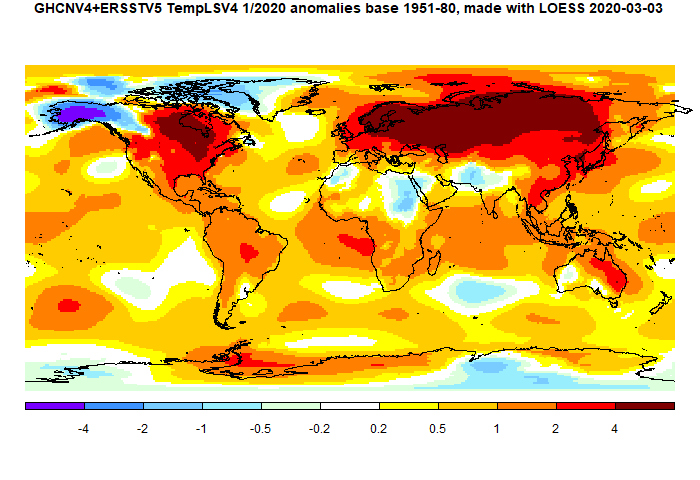 As always, the 3D globe map gives better detail.
This post is part of a series that has now run since 2011. The TempLS mesh data is reported here, and the recent history of monthly readings is here. Unadjusted GHCN is normally used, but if you click the TempLS button there, it will show data with adjusted, and also with different integration methods. There is an interactive graph using 1981-2010 base period here which you can use to show different periods, or compare with other indices. There is a general guide to TempLS here.
The reporting cycle starts with a report of the daily reanalysis index on about the 4th of the month. The next post is this, the TempLS report, usually about the 8th. Then when the GISS result comes out, usually about the 15th, I discuss it and compare with TempLS. The TempLS graph uses a spherical harmonics to the TempLS mesh residuals; the residuals are displayed more directly using a triangular grid in a better resolved WebGL plot here.
A list of earlier monthly reports of each series in date order is here:
I saw that you commented on Spencer's 4x error post. I tried posted on his own blog, but it must be hung up in moderation. Anyway,
ReplyDelete1) you are right, one key error in his model is the assumption of a constant "natural background". Interestingly, he himself solves for a background higher than 280 ppm... which leads me to wonder if his method could actually approximately diagnose the increase in "equilibrium CO2" (e.g., if we were to stop emitting today, what concentration would the atmosphere relax to in a few hundred years). He could fit his function for each 20 year period, and see if the so-called "natural CO2" increases from period to period.
2) Somehow, he made a factor of five error. I used his own approach to calculate the uptake for the RCP models in the 2000s, and it was 2.6% compared to his estimate of 0.5%.
-MMM
Yes. Did you see that Roy has now posted a correction. He now agrees with the RCP past results. He still queries the RCP projection of increasing airborne fraction.
DeleteCO2 uptake is a complex subject. Just considering that the diffusional sequestration has a fat-tail of thousands of years, and the thought that the dissociation factors have a role in establishing partial pressure equilibrium (see Revelle factor, Bolin's work). In other words, the path from non-equilibrium dynamics to equilibrium thermodynamics is tortuous and is not conducive to a controlled experiment. IE, this isn't just a can of carbonated Coca-Cola we are talking about.
DeleteThe frustrating thing is that Spencer is a real scientist... but he falls for this again and again.
ReplyDelete2009: http://www.drroyspencer.com/2009/01/increasing-atmospheric-co2-manmade…or-natural/
2014: http://www.drroyspencer.com/2014/08/how-much-of-atmospheric-co2-increase-is-natural/
and now 2020.
He said in 2014 about Salby, "The scientific community doesn’t take kindly to some of us suggesting nature itself might be causing “carbon pollution”. Baaad scientist."
What the scientific community doesn't take kindly to is scientists who should have the basic skills to read some textbooks, consult the literature, and recognize that people who have spent their lives working in the field are unlikely to be disproved by a 20 minute Excel analysis... and it is instructive that the people who think that the climate scientists have their thumbs on the scale always, always, always come up with explanations that make warming and/or the human contribution to warming look smaller - you'd think that if they were real skeptics, occasionally they might make a mistake the other way?
Yeah. I remember that 2014 thread. The note at the top is astonishing:
Delete"NOTE: The following post has led to many good comments. The best argument advanced that I am wrong is from a ~1,000 year record of CO2 from the Law Dome ice core (a record I was unaware of) which suggests the recent CO2 increase is almost entirely anthropogenic in origin."
Six years later it still boggles my mind that Roy "was unaware of" the Law Dome ice core CO2 record. Gotta love it when "scientists" write blog posts to be read by thousands of people despite being self-admittedly unfamiliar with central aspects of the topic they're writing about.
The odd thing about Murry Salby is that he's written lengthy textbooks on Physics of the Atmosphere (>700 pages) and Climate and Fundamentals of Atmospheric Physics (>600 pages).
DeleteWhat exactly happened to Salby?