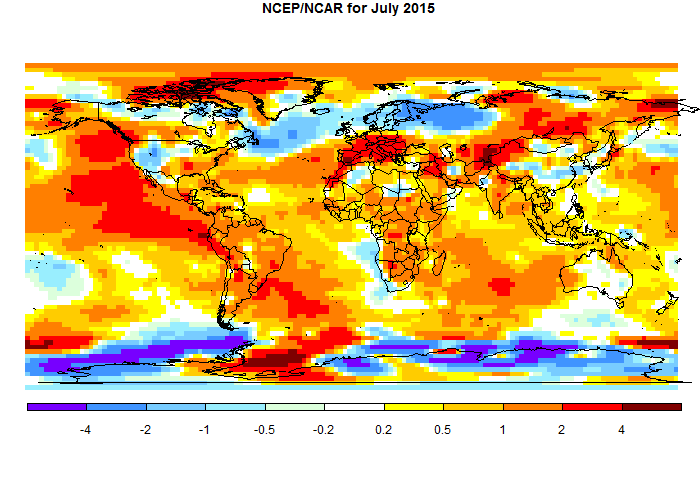
Update - with most data now in, the result is much the same.
In other news, Arctic ice has been melting fairly briskly; currently it stands about equal to 2011, but with more ice than 2007 or 2012.
Here is the spherical harmonics plot from the report

For comparison, here is the similar map for the NCEP/NCAR index, to the same 1951-80 base:

It looks a lot redder, mainly because I have used GISS data to put it on a 1951-80 base, which had a generally greater rise since then. Also the spherical harmonics smooth out extremes. TempLS shows cold in India, where ground stations have not reported. This may be spurious and make a small increase in the average when the land results come in.
Here is the attribution plot. Compared with June, there is a further rise in SST, but weaker land contributions, and continuing cold in Antarctica contributing to the result. This may mean that GISS and NOAA, which have a large SST component, may show as relatively warmer, although TempLS should be equally sensitive to SST.

Nick
ReplyDeleteHave you ever superimposed the evolving jet streams during a month over the relevant temperatures for that month, as shown in your two top charts.?
The Met Office has recently started to talk about them quite a lot in their TV weather forecasts when explaining why we receive the weather we do. I think the jet stream is enormously influential in determining our weather and its position if 'stuck' could determine the characteristics of a whole season. Here is the UK jet stream data
http://www.netweather.tv/index.cgi?action=jetstream;sess=
I don't know how well the temperature charts correlate with the jet stream but its an interesting area of research
tonyb
Tony,
DeleteNo, I haven't. It might be more appropriate to match it with the daily NCEP data. I'll see what can be done.
Nick
DeleteThanks. Look forward to it.
tonyb
Tony, I've done some looking around. Not so easy. NCEP/NCAR I use because it is kept current, and has reasonable size downloads. But they offer only surface winds. Other reanalyses tend to have huge downloads and lack currency. But I'll keep looking.
DeleteNick
DeleteYour efforts are appreciated
tonyb
Gistemp July is here now, 0.75, down 0.04 from June. JMA also reported today, warmest July ever.
ReplyDeleteThis suggests another hot month for gridded datasets, but not for those with global coverage...