They let you draw graphs of annual data, and plots of each month over years, but frustratingly, not a monthly plot. This may be to avoid including seasonal variation; they are not anomalies. However, they do give tables of the monthly average temperature for various reanalysis methods, to only 1 decimal precision :(. Despite that limitation, it is useful for me, because I had wondered whether the convenience and currentness of the NCEP/NCAR data was undermined by its status as a first generation product. I now think not; the integrated global temperature anomaly is quite similar to more advanced products (MERRA is something of an outlier). More below the fold.
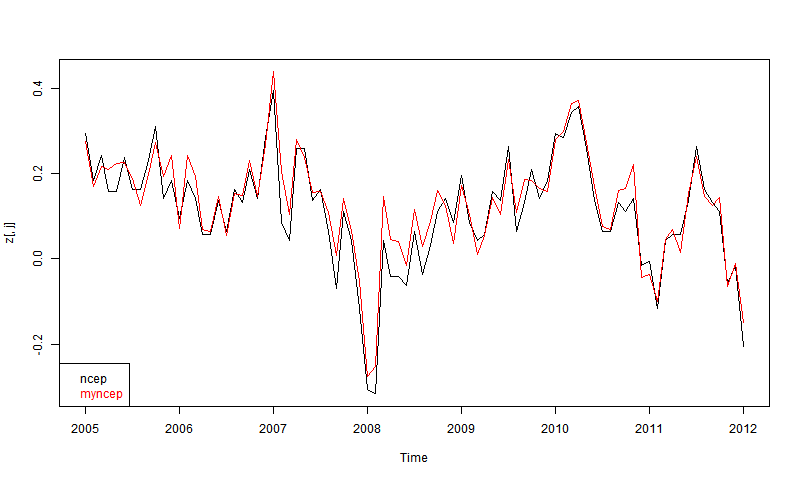
The first thing I wanted to check, since they give NCEP/NCAR v1, is whether they get the same answers as I did by integrating the grids. Again, CCI data only goes to 2012. Here is the plot for the most recent 8 years, set to 1994-2013 anpmaly base (actually to 2012 for the CCI version).

At first I was disappointed that they didn't overlay more closely. Then I remembered their 1 decimal accuracy, and then it seemed quite good agreement. You don't see 0.1 steps, because I've subtracted each month's mean. There may also be discrepancies because my numbers are likely more recent.
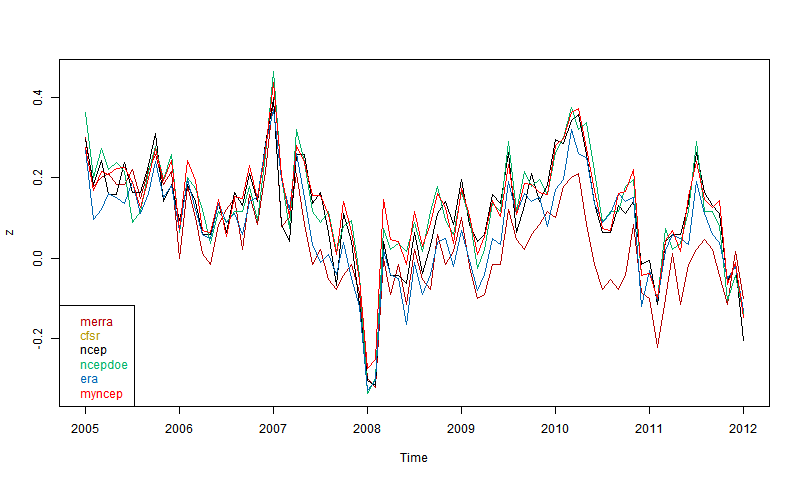
So then I plotted 5 reanalyses as shown by CCI. These are the main ones that go to near present (usually some time in 2012). You can read about them in the CCI guide. ERA is ERA-Interim. Ncepdoe is NCEP/DOE.

Again. quite good agreement if you allow for the limited precision. Surprising that MERRA, supposed to be one of the best, seems most deviant, even though others like CFSR are also well-regarded. It may of course be that MERRA is right. But anyway. there is nothing in the plot to disqualify NCEP/NCAR.
So I'll stick with it. It seems to be the most current, and I appreciate the 8 Mb download (for daily update). CFSR, for example, seems to come in multi-Tb chunks, which for me would be a multi-year task just to download. Resolution is not an issue for a global average.
In the Arctic at least MERRA and ERA-Interim have performed very well against out of sample data but we noticed (in one of our updates on the CW2014 website) some odd patterns over Africa for MERRA. MERRA Temps are not assimilated from the surface remember as opposed to most of the others.
ReplyDeleteOne of the faults mentioned with NCEP/NCAR was deviant Arctic patterns, attributed to higher spherical harmonics trying to match inadequate data. But that is where integration helps. The higher SH may look odd, but their integrals have to be zero.
ReplyDeleteThe CFSR is available in smaller bits than that. I've pulled hourly resolution daily files, and can get modest size files at lower resolution. iirc more like 20 mb than 8 per day. Perhaps smaller than that too.
ReplyDeleteThanks, Robert,
DeleteI'll try again. I'm pretty happy with the NCEP system though. I'm using it for daily updates during the month. Long-term accuracy isn't critical; it's basically to get a sense of how the month is going until the compilations of surface data come in.
If it ain't broke, don't fix it. Both are NCEP systems, just CFSR is the more recent and has higher resolution (and better physics + data). If you have questions about them, feel free to drop me a note.
DeleteThanks for the feedback on CFSR.
Delete