"the UAH record shows no trend since August 1994, a total of 18 years 9 months."
This surprised me, because I knew UAH had risen quite a lot, so I noted that the trend was actually 1.38°C/century over that period. I was reproved
"Not statistically significant is the same as no trend far as we’re concerned."
and indeed Willis came in later to say
"I assumed you knew that everyone was talking about statistically significant trends, so I didn’t mention that part."
Phil Jones was famously hassled about whether there had been statistically significant warming since 1995, which lead to lots of "no warming" stuff. And there were even Keenan-inspired questions of the Met Office in the HOuse of Lords.
You'll notice this talk is coming from skeptics. Scientists don't spend a lot of time worrying about whether trends are "significant". There's good reason for that.
Significance tests can't prove anything. They seek to disprove a null hypothesis. And the question of whether the temperature trend was zero is of little interest. No-one expects that it would have been. So the question of disproving that is not important to them. And I can't imagine why skeptics think it is important to disprove that the trend was zero.
Lucia writes a lot about significance tests, but she always tests trends which, rightly or not, she associates with AGW sources. That makes sense - disproving those could mean something.
Anyway, Willis' example above illustrates what is wrong with equating no warming with no significant warming. It's quite possible for warming exactly in line with AGW predictions to be sytatistically insignificant, because of the number of observations and their noisiness. Now a theory can't do better than get it right. So in this post, I'll show how, under various measures of significance, various trends do not become significant until sustained for quite a lot of years. That's not because there's any doubt about whether they are happening.
I'll also look at the effect of measures. I'm planning a few posts on significance and autocorrelation. This arises partly because I'm now maintaining current data in my triangle trend plots. SkS has a trend calculator, and they give significantly different trend levels. The reason is that they use a different time series model. They give wider confidence intervals which lead to longer quoted periods of "no significant warming". I'll discuss the implications, and possible other methods.
Models of statistical significance
I'll say more about the maths of this in an upcoming post. For the moment, I'll just identify three models of linear regression residuals:- Naive OLS
Assumes that after linear regression, the residuals are independently distributed. Markedly untrue for monthly surface temperature data. Not bad for annual averages.
- Autocorrelated residuals.
With an AR(1) model, the one most commonly used (if not naive). Often in conjunction with a Quenouille approximation to get the uncertainty. This is quite good for moderate autocorrelation, and if the model is inadequate, it is probably not because of that approx. My trend viewer uses it.
- ARMA(1,1) model, as described by Forster and Rahmstorf. This has an extra degree of freedom, which allows the autocorrelation model to flatten when the lag-1 correlation indicates a steep slope. It is used by the SkS calculator.
Methods
I'm using the R arima function. The actual call for a time series T is:h=arima(T,k,xreg=time(T)/100)
where k is c(0,0,0) for OLS, c(1,0,0) for AR(1) and c(1,0,1) for ARMA(1,1).
h is a structure with a vector of coefficients h$coefs and a covariance matrix h$var.coef. The last coef is the trend, and the last diagonal in the cov matrix is taken to be the variance. In fact there's no simple variance for a multiple parameter model, but the matrix is diagonally dominant.
Significant trends
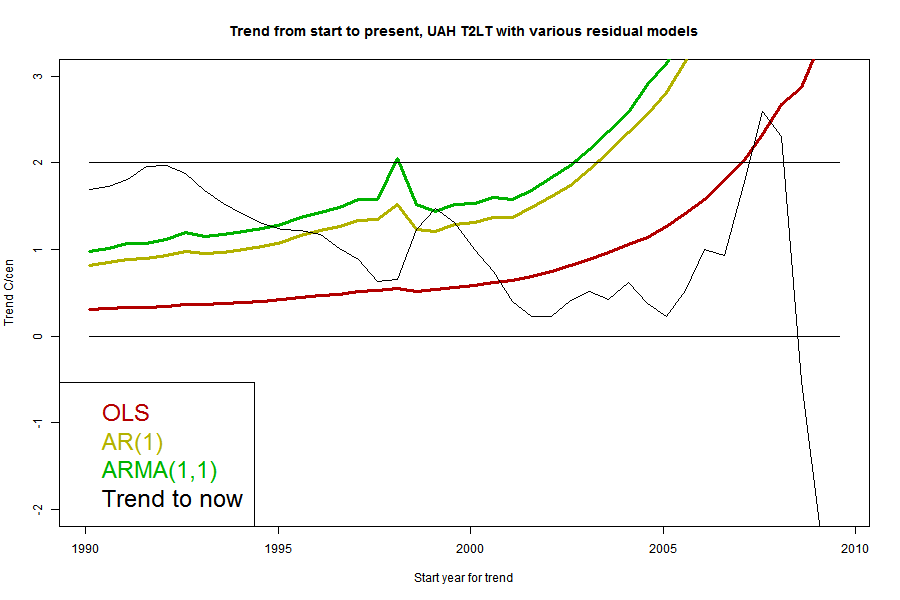
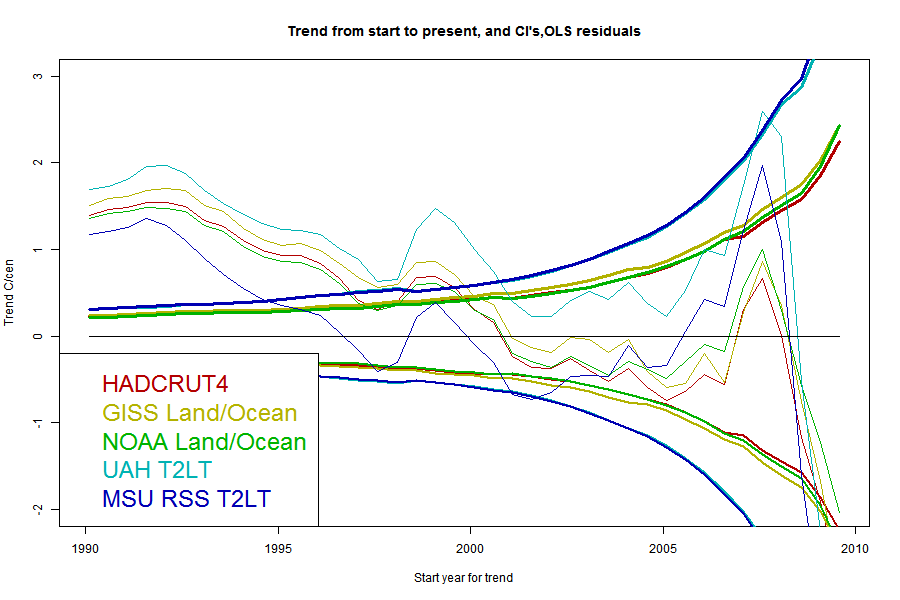
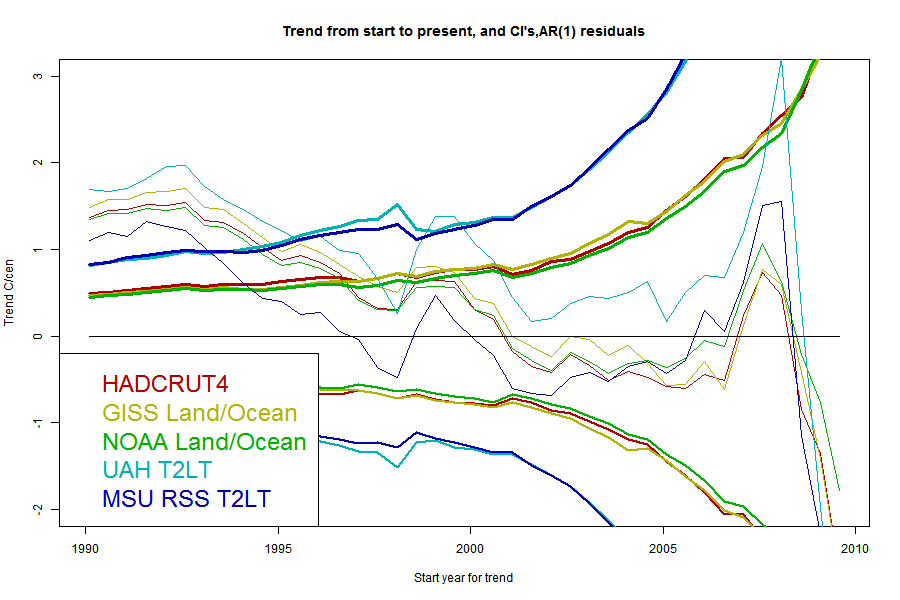
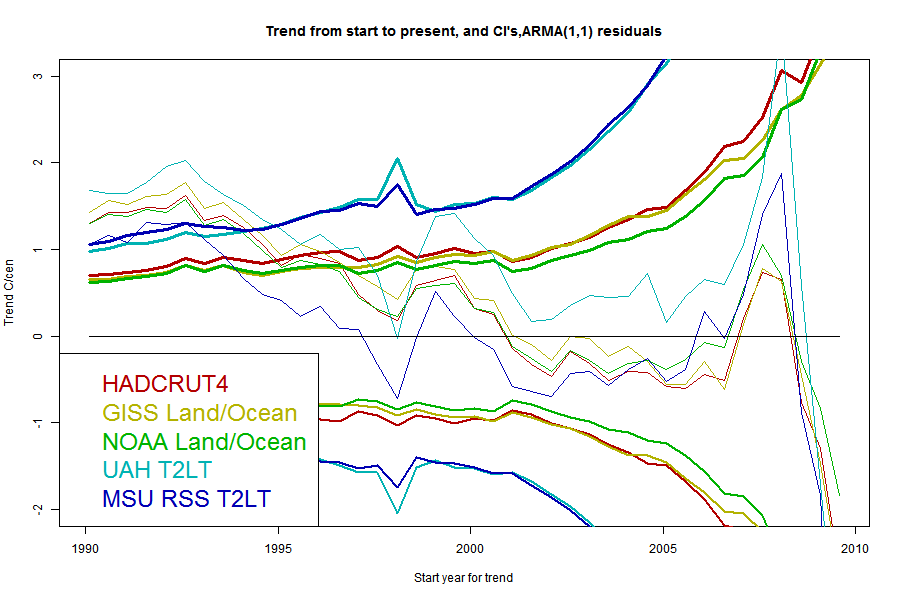
I'll plot the 95% uncertainty levels of trend (1.96σ), for periods ending Jul 2013 and starting in years going back in time, for each of the five common datasets, HADCRUT4, GISS Land/Ocean, NOAA Land/Ocean. UAH T2LT and MSU RSS T2LT. For any given uncertainty level, trends starting to the right of the line are not significant. I'll also plot the actual trends, in the same color; where the two curves cross is where the period of significantly positive trend starts. I'll do this for each of the three model types.But first, because it's easier to explain, I'll show just one data set, UAH T2LT, with the three models.
 The black curve is the trend for the period from the starting date on the x axis to now (July 2013). The colored curves are the 1,96σ levels for each of the models for the residuals. Where the black curve is above the color, the trend from that year is significant. Where they cross is the most recent month for which it could be said that there has been no significant trend. A complication is that it may cross more than once.
 Because the se for the ARMA(1,1) model is larger than the others, it gives a longer period of "no statistically significant trend". However, it's worth noting that the crossing point is at quite a high level; nearly 1 °C/century. That's a general pattern, because generally the trend curves have a negative slope in this region. It illustrates the point above - the trend may not be significant, but may also be fairly close to what was predicted.
It's interesting that the CI does not monotonically decrease with increasing period, but has a small spike around 1997. The error of the trend actually increases here (going back) because of the big 1998 spike with dips on each side. We;ll see that this is mainly a feature of the satellite measures.
I've marked a horizontal at 2 °C/century, which is often said to be an AGW predicted level for this time. You can see that the multi-parameter models which give a long period of no significance, would say that even this level, agreeing with prediction, was insignificant for nearly a decade.
Now here are a series of plots showing the trends, CI's and crossing points for each data set - one plot for each stochastic model:


The same pattern - as parameters are added the CI's widen and the "no warming" period extends back, but the actual degree of warming becomes increasingly positive.
Conclusion
I don't think scouting around for a period free of significant trend is a useful activity, because it doesn't actually prove that the theory made a bad prediction. For that you have to test the deviation from the prediction.But if you really want to do it, you have to deal with the fact that there are different models which give substantially different answers. And models that allow long periods mark as insignificant periods that are increasingly in line with what was predicted.
In my next post, I'll look at the Akaike Information Criterion, which gives at least some objective criterion for choosing models. I'm also hoping to present a model-free approach.
No comments:
Post a Comment