Thursday, February 24, 2011

Antarctic, RO10, Steig and TempLS.

At the end of his RC post (in happier days), Eric Steig said of the OLMC10/S09 situation: "This probably means going back to the drawing board to write up another paper".

Well, this post suggests another method, using TempLS v2. TempLS was a program written last year, originally to provide alternative calculation of the main global temperature indices. It did that. It works on a different basis to most other such codes - instead of gridding anomalies, it fits a linear model to global temperatures by weighted least squares.

Version 2 extended this to fitting spatial variation parametrised by coefficients of basis functions, intended to be families of orthogonal functions like spherical harmonics. But the EOF's introduced by Eric Steig for the Antarctica analysis would do as well.

This post describes some preliminary results. There are some loose parameters which will need better definition. I have done almost no verification stats. The trends come out rather high. But the patterns are quite similar to the O10/S09 results. And their are some big plusses. One is simplicity - run times are a few seconds instead of the 40+ minutes I found with the RO10 method. And the simplicity means that one can experiment with more things - eg spatial weighting.


Review of TempLS

There is a description of the math in V1 here. There is a general overview of stage 1 of the project here. You can find a complete listing of old posts (by category) at the Moyhu index. Incidentally, I've had to move the document repository recently, so if you have trouble finding online materials, the new location is here

The math description of V2 is here. In V1, global temperatures were represented by the model:
The data has a number of stations (s), with temperature readings (x) by year (y) and month (m). m varies 1:12. Then x can be represented by a local temperature L, with a value for each station and month (seasonal average), and a global temperature G depending on year alone.

xsmy  ~  Lsm  +  Gy

This is fitted by area-weighted least squares. The weight function w is an estimate of the inverse of the local density ofstations. The local temp L includes the variations due to station location, including seasonal effects, leaving G to represent global influences.

In V2 this modelling was extended to allow G to include spatial variation. As a computing trade-off, it was no longer allowed to vary freely with year. Instead, the part of interest here (model 2) required that it vary linearly with year, so the trend could be estimated.

The model is:
xsmy ~  Lsm +  J yPsk Hk

Here J is a linear progression in y; P is a set of values of k basis functions at s locations, and H are the set of coefficients to be found. I'm using a summation convention, so summed over k. In the present context P can be the values of the satellite EOF's.

Ground station results

The natural starting point would be to take x as the set of ground station temperatures. There were 109 ground stations in total, 44 manned and 65 AWS. However, 5 were omitted in O10 for various reasons, and are omitted here. I also excluded stations above latitude 60S, although I forgot to include this in the count shown in the trend plots. The total was then 99.

TempLS would normally weight by area density, but since AFAICT S09 and O10 did not do that, I won't either at this stage. The normal scheme based on lat/lon cells gets a bit messy. So here is the standard TempLS output - the map of stations and the graph of numbers of stations in each year. All the analysis will be from 1957-2006. You can right-click to see the small pics in full size.


Map of ground stations

Numbers reporting

Trends

On the right is a plot made using Ryan's plot routine for consistency (and because it's good). At the top are indicated some parameters (more explanation soon), and the trends for the Continent, and for the Peninsula, West Antarctica, and East Antarctica (see map). The main parameter of importance at this stage is that 6 EOFs were used.

Comparison

Here are some results described on Ryan's post, and from Eric at RealClimate
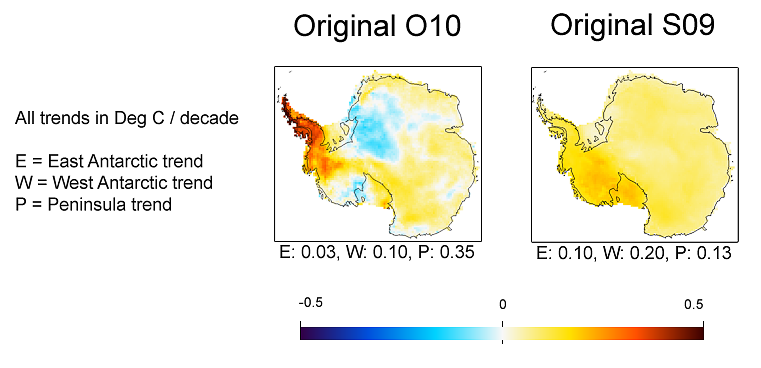

From  Ryan's post
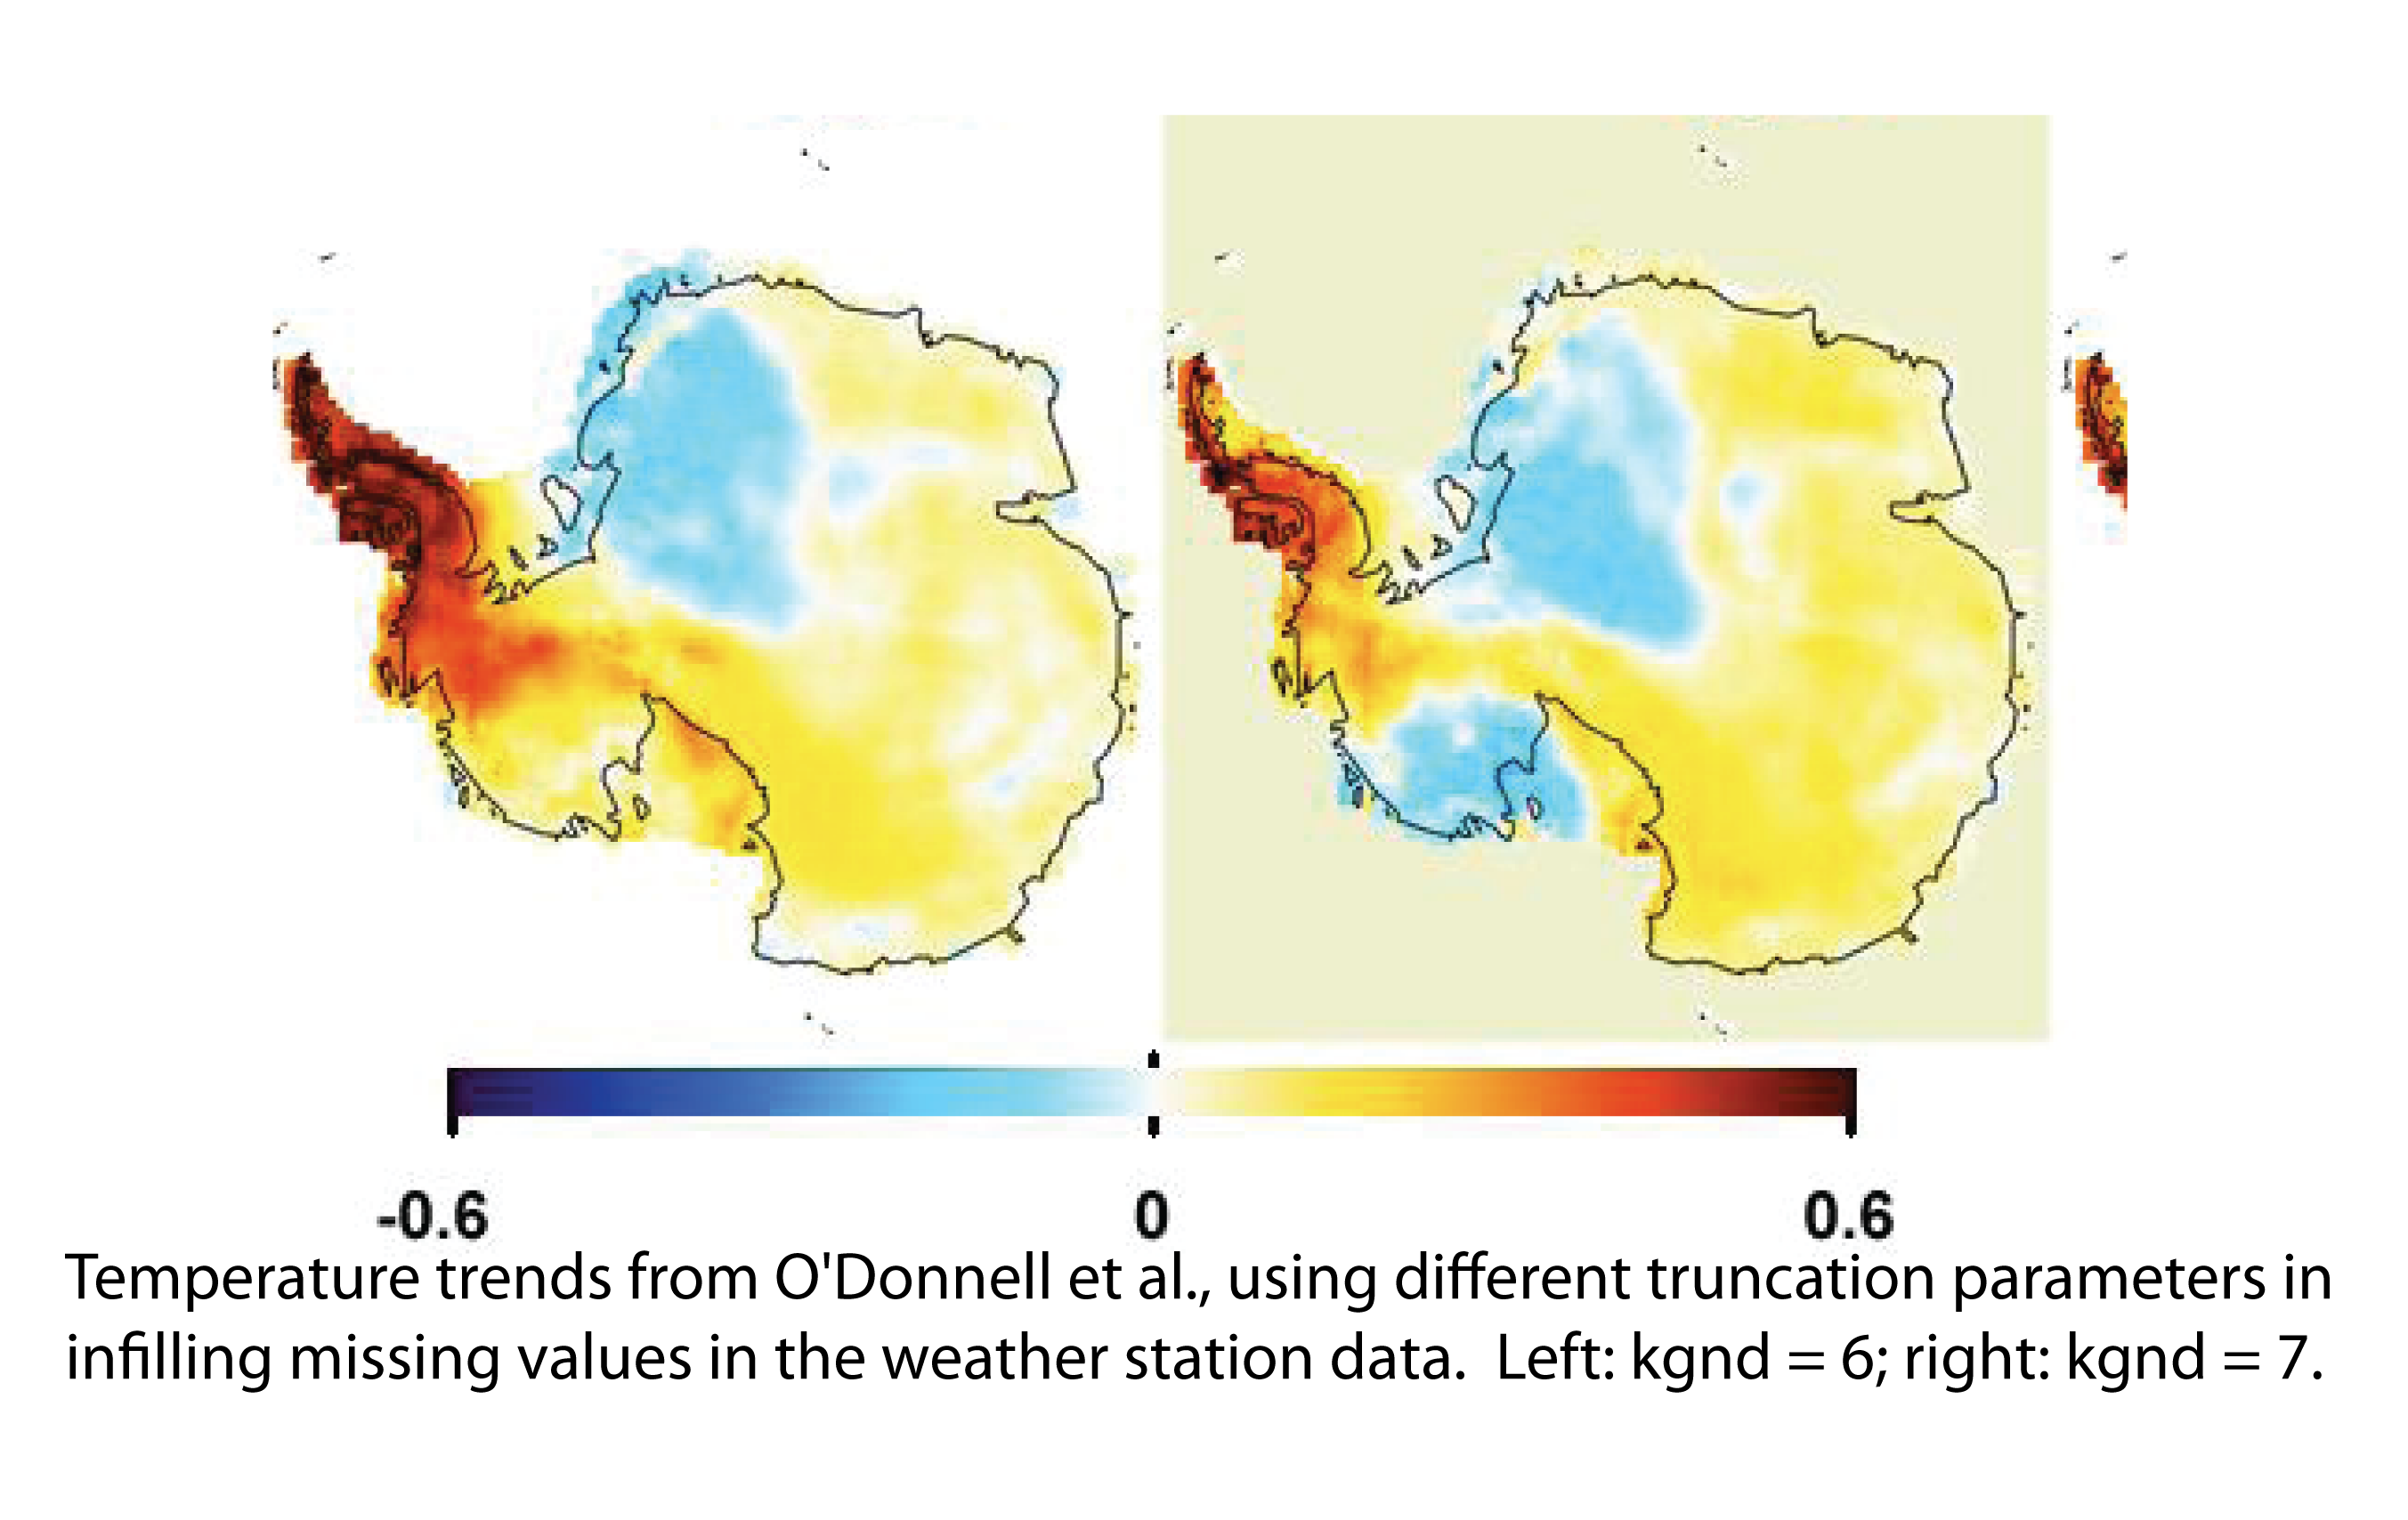
from  Eric at RealClimate

The TempLS pattern looks quite like O10's, but with larger trends in both directions. In the comparison, the continental trend was 0.06 for O10, and 0.12 for S09. So this value of 0.10 is in between. The Peninsula value of 0.56 is higher than both, as is the WA value, and EA is lower than both. But remember, the analysis so far was ground stations only

Use of AVHRR data

A key part of both S09 and O10 was infilling using both ground and AVHRR data. TempLS doesn't do infilling, but the natural equivalent is to add in artificial stations with AVHRR data. This was done with land/ocean indices - artificial stations created with SST data.

We have 5509 AVHRR grid points, which gives more than enough coverage density. I reduced by a factor of 4 (leaving out alternate rows and cols in the rectangular grid of cells), making about 1392 in total. Theer will need to be relative weighting to prevent the ground stations being swamped, but for the moment I'll show the AVHRR stations only:


Map of AVHRR "stations"

Numbers "reporting"

Trends

Mixing ground and AVHRR data

Now it's time to combine the data sets. There's no problem doing that - they are all in the same listing. The issue is relative weighting. If we want ground stations and AVHRR to have a roughly equal influence post 1980 (when both are available), then it would be appropriate to upweight the groundstations by a factor of about 15 (or maybe more, since ground stations have missing values, AVHRR generally not). So here is that case:


Map of AVHRR "stations"

Trends

Again a pattern somewhat like that of O10, but with higher trends everywhere. The continent trend of 0.18 C/decade is very high.

Now it's time to explain the parameters shown on the trend plots. First is the number of ground stations, and then the number of AVHRR grids (though due to an error in the output program, this was underreported by 5). Then the weight factor, which is actually the number of extra times the ground stations are weighted (so if 15 is displayed, ground stations are upweighted by a total factor of 16). Then the number of AVHRR EOF's used as the basis functions. Finally, on the next line the trend values are reported.

Different weightings

OK, so we can try different weightings. I tried weightings of 8 and 40:


Upweighting of ground stations =8

Upweighting of ground stations =40


The upweighting by 40 gives a pattern quite similar to O10. But again the Peninsula and WA trends are much higher.

Varying number of PCs

I've retained 6 EOFs above. The considerations seem to be similar to the S09 method. 4-6 looks like a good range, with noise problems increasing above 6. Here are the variations at weight factor 40:

4 EOFs

5 EOFs

6 EOFs

7 EOFs

8 EOFs

9 EOFs

10 EOFs

Update. Here are plots of eigenvalues for the NxN matrix that has to be solved to get the coefficients (N=# PCs). I've shown N=5,7,10. The condition number is the ratio of largest to smallest. The max value of 53 for N=10 is getting large, but not disastrous.


What still needs to be done?

A lot. I've done virtually no verification stats. Some sort of cross-validation is needed to get an optimal value of the weighting parameter

But I've also committed the sin of Steig's initial Nature paper - I'm using OLS when there is likely to be some correlation. Eric used a Quenouille adjustment - maybe something like that is possible here, but the alternative is to replace a diagonal weighting array by an estimate of the inverse of a correlation matrix. That is unattractive in TempLS because the design matrix to be solved is very large, and made economic by the fact that two large block submatrices are diagonal.
here the cost of departing from that is not prohibitive; the calc is currently a few seconds. But it would complicate the code. 
(That isn't very accurate. The Santer/Quenouille correction affects the estimated error, which I haven't ventured yet. It wouldn't change the results quoted, although a fuller accounting for autocorelation would.)

And I could implement area-weighting. It's a bit complicated because of the differential weighting of the stations by type.

Update 27 May 2011
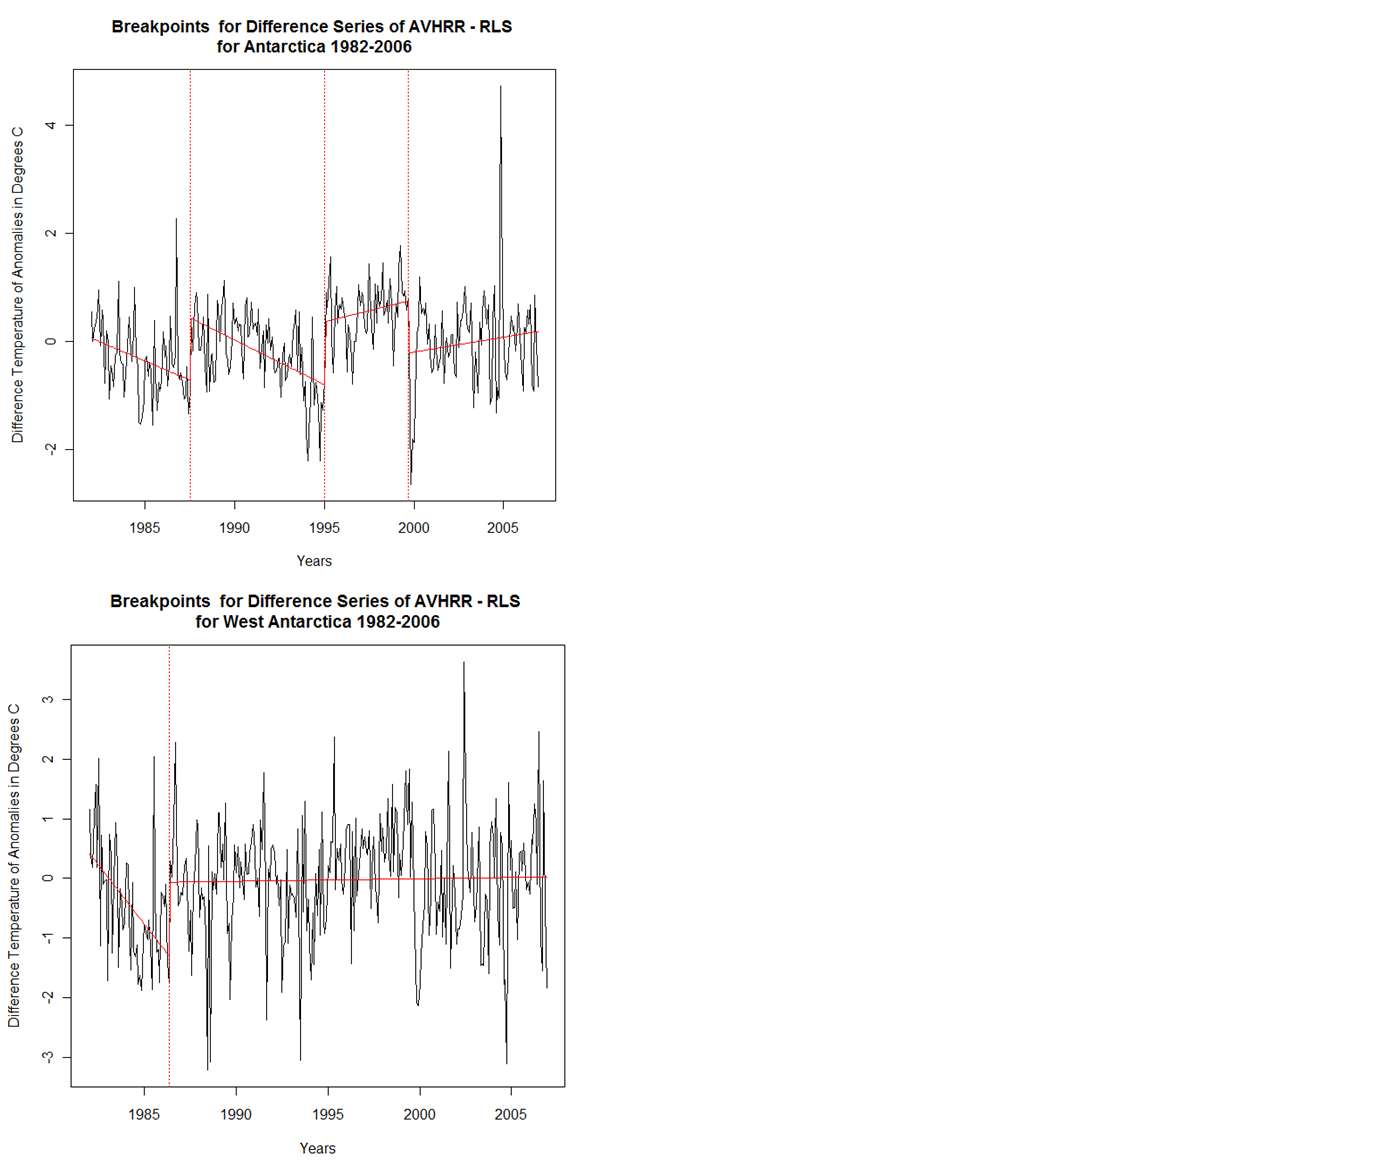
Kenneth Fritsch has been studying individual time sequences and breakpoints, as in the comments below. I'll link his graphics here:



Sunday, February 20, 2011

Ryan's code - testing.

I set out to do, as promised, a repetition of Ryan's sensitivity test with S09 using more AVHRR PCs. But I was distracted by what seemed to me to be a simpler and more informative test, which I'll report here. It gives a quantitative comparison and also can act as a kind of calibration.

I detrended all the raw station data. That is, I estimate and subtract the trend for each station, leaving the mean over the observation period unchanged. So we have data which should return a zero trend. What do we get?


I looked at four cases:
  1. SO9 with 3 PC's (Eric Steig's original)
  2. SO9 with 5 PC's
  3. OLMC10 with RLS (regularized least squares)
  4. OLMC10 with E-W (eigenvalue weighting)
The RLS results are the most quoted, and have been used in recent sensitivity tests. I took the time period from 1957-2006, all year.

Well, none of the methods reported a zero trend, although the magnitudes were reduced relative to real data.

Update 2. As noted below, detrending the raw data is not a good idea - it is much better to calculate the detrend slope using anomalies. I did this, and found that it had little effect on the S09 results, but a big effect on the OLMC10 method. The RLS performance was now better. Qualitatively, though, the results are similar. The RLS method still gives a negative trend, by about as much as S09 is positive.

Here are the plots, using the same color range as in my last post: 


S09 3 PCs


S09 5 PCs


RLS


E-W

Here are the new numerical trend averages in C/Decade:
EastWestPeninsulaContinent
S09_3 0.0285 0.05210 0.0357 0.0338
S09_5 0.0221 0.04810 0.0534 0.0289
RLS -0.0282 -0.00757 0.0309 -0.0214
E-W 0.0183 0.03990 0.0627 0.0247


This suggests also that S09 tends to return high trends - RLS low, to a slightly greater about the same extent, and E-W also slightly high. The magnitudes of the differences are comparable to the real data discrepancies. As a comparison of the magnitude of differences, here are the actual trends from real data, taken from Table 1 of OLMC10:
EastWestPeninsulaContinent
S09 3 0.10 0.200.13 0.12
RLS 0.030.100.350.06
E-W 0.02 0.060.320.04

The continent difference of 0.081 0.055 between S09/3 and RLS is slightly larger than comparable to the much debated real data discrepancy of 0.06. There may be something in Eric Steig's claim that ridge regression is reducing the trend.

Update. As soon as I posted this, I realised that it would have been better to detrend anomalised data rather than the raw data. Estimating trends of seasonal series with missing values and irregular endpoints is noisy. I'll post revised results in about an hour when the computing is done.


Here is the table I calculated earlier detrending the raw data:

EastWestPeninsulaContinent
S09 3 0.0285 0.05210.0357 0.033
S09 5 0.0221 0.04810.05360.028
RLS -0.0572-0.03530.0463-0.048
E-W 0.0001 0.02040.05200.0066


Thursday, February 17, 2011

Ryan's code - S09 with more PCs

In my last post, I was stuck. With help from Carrick (see update), I've been able to get a working copy of the code. I've revised the HTML markup file.

A full run takes about 46 min on my 32-bit Windows setup. Most of that is iridge. If I take out just the parts for S09, it's about 80 sec. So I did that, and started tinkering with the number of retained PCs. Ultimately, I want to see how much of the difference between RO10 and S09 is due to this factor.

For the moment, I have just plotted the all spliced trend maps for the period 1957-2006 for retained PCs from 3 to 7, using the RO10 implementation of Steig's method. Here they are:


3 PCs retained


4 PCs retained


5 PCs retained


6 PCs retained


7 PCs retained


8 PCs retained


9 PCs retained


10 PCs retained
Here for comparison is Ryan's recent plot from the Air Vent (which seems to have its puff restored).


As soon at Steig's method retains more than 3 PCs the trend plot comes to rather more resemble Ryan's, at least for 4:6 PCs retained. With 7 there is a change, which suggests that perhaps noise is becoming a factor.

Update. Here are the average trends for the various regions, in C/Decade. They are comparable to the values in Ryan's figure. Note that with higher PC numbers, there is some movement towards Ryan's values, although a significant difference remains. There is also a big change at 7 PC's, suggesting that this is the noise limit.

Update 2. I have added the cases 8:10 PCs retained. It seems to confirn that things get ragged once more than 6 Pcs are retained - possibly noise, though Ryan hints in comments that something else is involved. 

East West Peninsula Continent
3 PCs 0.09663 0.1911 0.1253 0.1180
4 PCs 0.09361 0.1723 0.2463 0.1167
5 PCs 0.07966 0.1667 0.2533 0.1054
6 PCs 0.07435 0.1632 0.2709 0.1014
7 PCs 0.11340 0.2364 0.2988 0.1473
8 PCs 0.1322 0.2245 0.3053 0.1590
9 PCs 0.1719 0.2575 0.2860 0.1949
10 PCs 0.1605 0.1083 0.2100 0.1514


Monday, February 14, 2011

Ryan's code

I'm trying to run Ryan O'Donnell's code for the Antarctic paper (O10), in the form that he posted at the CA site. The datafiles are there too. The code is called RO10%20Script.R.

Update 16 Feb. Carrick says in the comments that he used the file RO2010 Code.txt, in the same dir, and that it ran to completion. There is a readme.txt file which mentions this latter file and not the .R file. The .txt file does not have the apparently defective code that I report being stuck on below. I am currently running it, and it reaches the error pointed out by JohnA. This is at a much later stage in the running, so that is good news.

The confusion over the codes is puzzling. In that same CA thread, pax noted an error which I nad also encountered, and Ryan said that he had fixed it. In fact, he updated the .R file, not the ,txt one.
Anyway, I'll switch to the .txt file. 

  References for  Antarctica posts:
The discussion is prompted by two papers:
S09, a 2009 Nature paper by Steig et al and
RO10 (or O10), A 2010 J Climate paper by O'Donnell et al.
There has been heated blog controversy about these papers - this post is just one entry point. Here is a Real Climate post following S09's original appearance, and here is Eric Steig commenting on O10 (this led to other heated postings).


It's a long file. Eric Steig said that he found it hard to follow, preferring that it be broken up into separate files. But for turnkey effect, one file is more convenient.

When I'm trying to understand how a long program works, I often get into it with emacs and make a html version with links. Then one can make a table of contents, and link function calls to their definitions etc. And also color things. I've done that online here, and the source is available in a file (ryan.htm) I've uploaded at the document depository. It's not for running - just an aid to navigating around the code.


As far as running goes, I've come to a halt. I've asked Ryan about it here. Ryan has said that this part wasn't used for the paper. But there's a lot more code below it.

The run has completed the sections
LOAD AND PARSE DATA
SATELLITE OFFSETS
IMPUTATION EXPERIMENTS
and reached
RECONSTRUCTION
It did an infill with iridge and produced some plots
main.gnd = emFn(Yo, maxiter = 500, tol = 0.0005, type = "iridge", plt = c(T, 41), DoFL = 12).

But then it gets to the section
###Infill satellite PCs: Eigenvector-weighted method, optimal settings
and the first call to getEigen:
"eigen.pcs = getEigen(Y, pc.max = 13, type = "tsvd", maxiter = 500, tol = 0.0005, n.eof = 9, covr = FALSE, wt = TRUE, alpha = 100, progressive = c(T, 1, T, 1)) "

This is where most people have got stuck a problem, because covr is not an argument of getEigen. But if you take it out, you get, via a call within getEigen to emFn, down to tsvdRegFn:

tsvdRegFn = function (arg, dat, char, fn, n.eof, iter) {

   ### Remove unnecessary matrices
   dat$C = dat$C.res = NA

   ### Setup Xhat
   Xhat = matrix(0, nrow = arg$n, ncol = arg$p)

   ### Find scales and weighting factors
   if (arg$covr == TRUE) {
      D = arg$wts / rep(1, arg$p)
   } else {
      D = sqrt(diag(dat$C))
      D = arg$wts / D
   } 


and there's my current puzzle. D = sqrt(diag(dat$C)) acts on something that has just been set to NA. Although when I look at it with str(), it seems to be a logical scalar anyway.

I wish I could explain better what has really happened here, but I'm trying to familiarise myself with the algorithm by running the code. I'll post again when I've made more progress.


Friday, February 11, 2011

On words

There has been more recent discussion, partly inspired by Steig and Trenberth, on the use of a word that is also a silk measure. I don't use the word, though I don't see anything wrong with doing so. I refrain because it leads to time-wasting arguments.

The preferred alternative is skeptic. I have used that, spelt with a k. Spelt with a c, there's a danger that consistent pronouncers will make the c soft. I might even omit it in text, which would lead to trouble.


However, skeptic isn't right either. I regard myself as fairly skeptical, and I'm expected to apply the word to some people who believe in all sorts of weird things.

As a digression, we have an association called the Australian Skeptics. I know the founder, and would have joined, but there is only so much time available. They mainly focus on religion and the paranormal. They took the name long before it was associated with climate.

They have many scientists, and could not be classified as climate skeptics. They did have a meeting in Hobart a couple of years ago which covered climate - I would have liked to go. It did not look like a climate skeptic meeting.

Anyway, back to topic. I've been looking for a new word. One that has been used occasionally is contrarian. I like it. Some might think the suggestion of "contrariness" is disparaging, but it also could mean contrary to the consensus, which might make people feel better.

The problem is that it's long, and I like short words. Maybe some would embrace the term "contra"?


Wednesday, February 2, 2011

Tropical Cyclone Yasi

This is a monster. I just hope for the best for people in North Queensland. WUWT's latest post gives thorough coverage, although I wish they would let alone the premature whinging about people talking about AGW.


For dramatic and informative pictures of its development, the BoM satellite images are here.